This week, JLF’s Dr. Terry Stoops published a research brief that delves into recently released N.C. public school data. According to Stoops:
The N.C. Department of Public Instruction released the 2018-19 state accountability results this week. The release included end-of-grade and end-of-course test results, growth (or value-added) scores, school performance grades, graduation rates, and other indicators of student achievement.
Dr. Stoops examined both student performance and school performance.
Student Performance
On student performance, Stoops explains:
North Carolina public schools measure student performance on state tests using two primary measures: proficiency and growth. While proficiency is determined by the number of questions answered correctly, growth captures student performance relative to their scores on previous tests. Students may not reach proficiency, but they may demonstrate positive growth. Likewise, a student may be proficient in a subject but exhibit minimal or no growth.
Below is a table of reading and math proficiency for students in grades 3-8 and science proficiency in grade 5 (Table I).
| Table I | |||
| Subject | 2017-2018 Proficiency | 2018-2019 Proficiency | Change |
| Reading | 57.3% | 57.2% | – .1% |
| Math | NA | 58.6% | NA |
| Science | 68.9% | 72.6% | + 3.7% |
Dr. Stoops writes:
Overall, reading performance is stagnant, math performance is to be determined, and science performance is strong.
On Student growth, Stoops writes:
73.3 percent of North Carolina schools met or exceeded their academic growth goals. That was a 0.6 percentage point bump compared to the year before.
School Performance
School performance is measured on a graded scale in North Carolina. Stoops explains:
Both proficiency and growth rates are included in school performance grades. Proficiency rates (and performance metrics specific to high schools) account for 80 percent of the grade, while growth makes up the other 20 percent. Those measures are combined and scored on a 15-point scale. Across all district, charter, laboratory, and regional public schools in the state, 8.0 percent received an A, 29.3 percent scored a B, 41.1 percent logged a C, and the remaining 21.7 percent earned a D or F.
North Carolina, in the past, published comparisons of district, charter, lab, and regional schools. Dr. Stoops reproduced those comparisons this year with the published data (Table II).
| Table II |
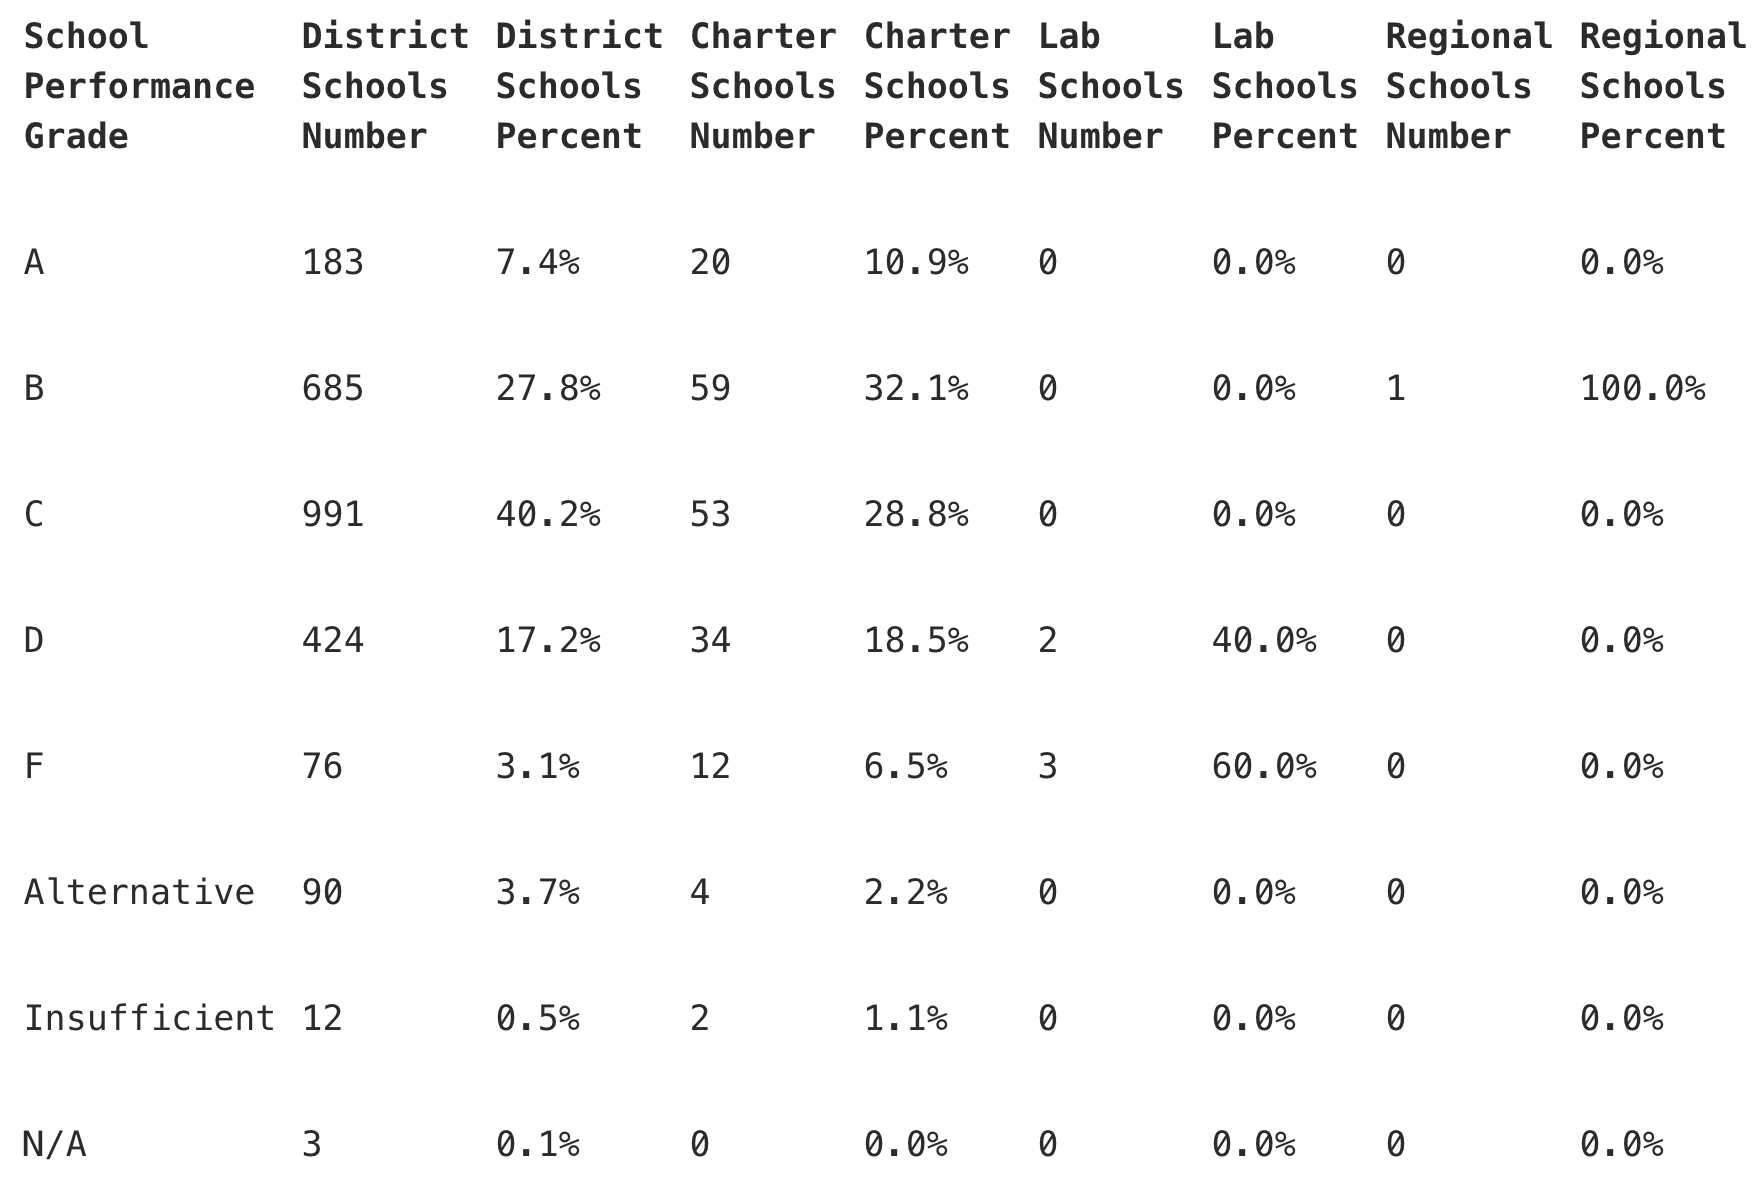 |
These data mirror past trends of charter schools with higher A and B distributions, but also larger D and F distributions than district schools.
In conclusion, Stoops writes:
Across all subjects and grade levels, 58.8 percent of North Carolina students earned grade-level proficiency, and 44.5 percent met the higher “career and college ready” standard. Both are trending in the positive direction, but the fact remains that around four out of ten North Carolina students are not on track to be prepared academically for life after graduation.
Read the full brief here. Find out your school’s performance grade here.