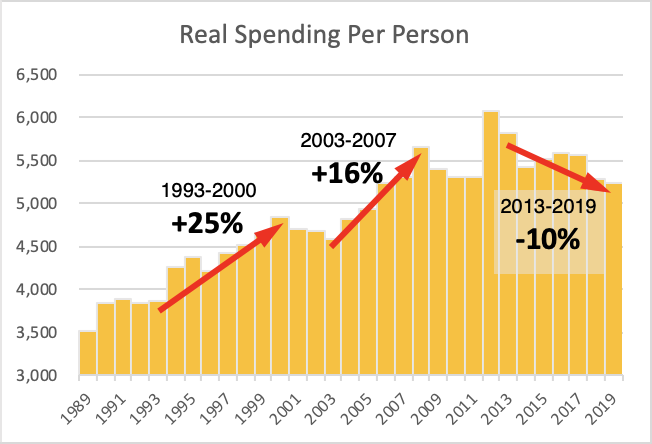
The General Assembly has provided real spending discipline since 2011, in marked contrast to the previous two decades. In the graphs below, we look first at the General Fund, then at total spending, then at the General Fund’s share of total spending. Within each set, we look first at inflation-adjust spending, then at inflation-adjusted spending per person, and finally at spending as a share of personal income.
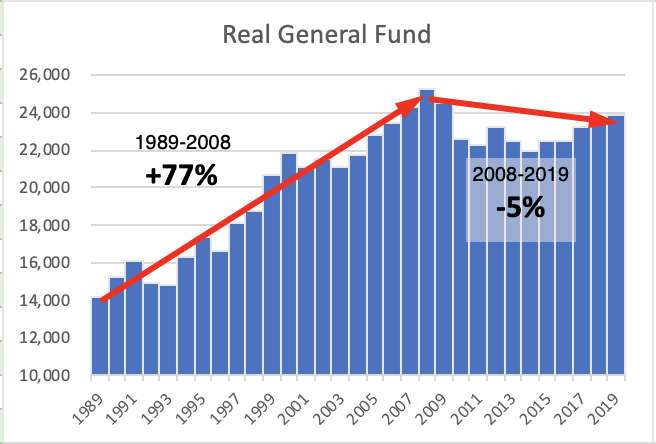
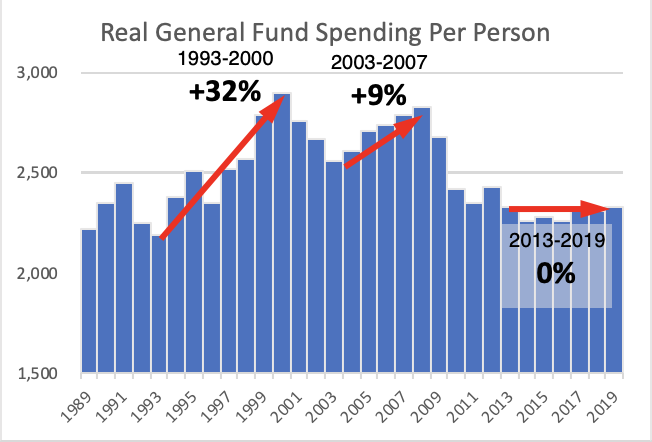
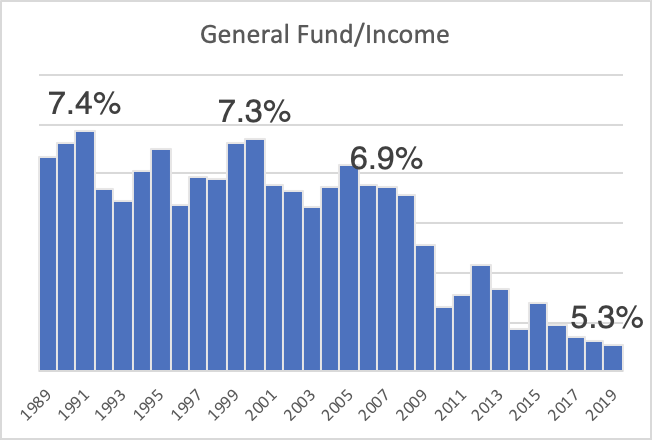
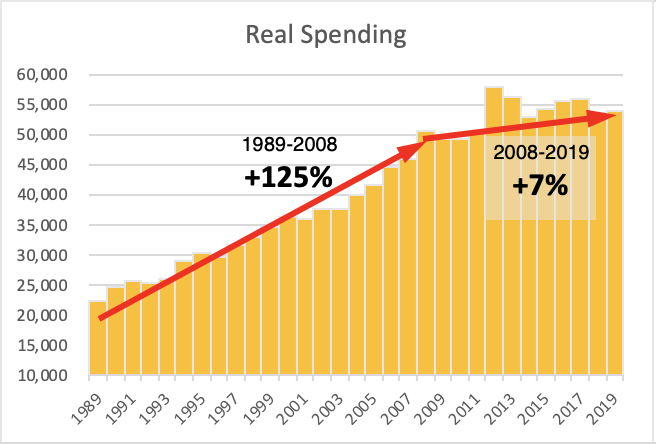
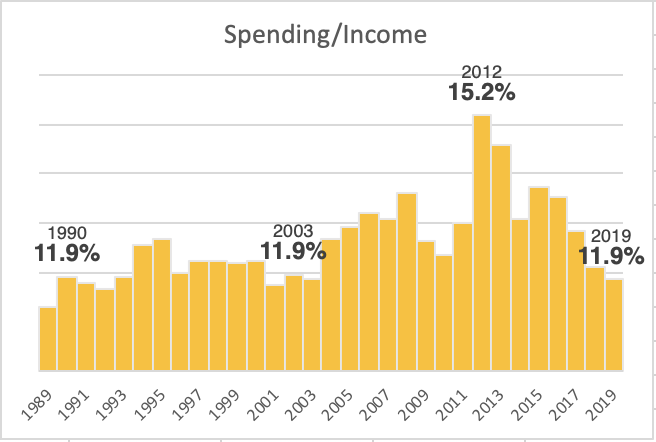
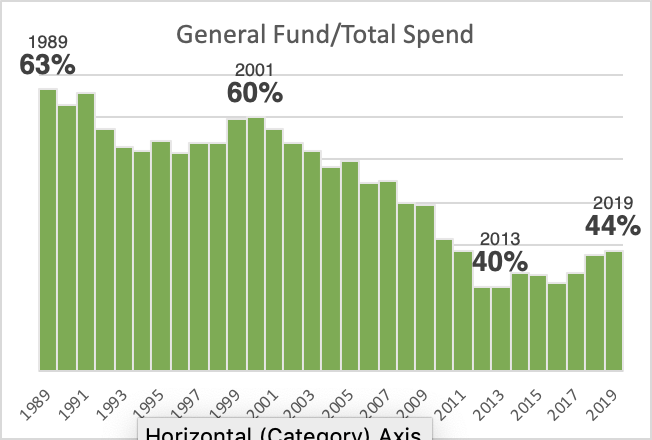
General Fund spending grew rapidly after recessions in the 1990s and 2000s, but that pattern has not repeated this time. Since spending hit it’s pre-recession peak, the General Fund is down 5 percent. Much of that reduction happened during the recession as the state took advantage of federal funds, but the cap on state spending has remained even as federal funds have declined. Total spending is again 11.9% of personal income and the General Fund is back up to 44% of total state spending, though still not close to the 50% or more prior to the recession. This spending restraint is why North Carolina has been able to reduce taxes consistently since 2014.
A quick note on the calculations here: We adjusted General Fund appropriations and total state spending for inflation and population two years prior to the fiscal year end. So for fiscal year year 2018-19, we look at inflation and population from 2017. Looking back to population and inflation seems more reliable than forecasting changes in the year ahead.