The John Locke Foundation is approaching its 30th anniversary, and the Republican majority in the General Assembly is halfway through its fifth session. It seems a good time to look back at government spending while we wait for the Senate to consider an override of Gov. Roy Cooper’s budget veto.
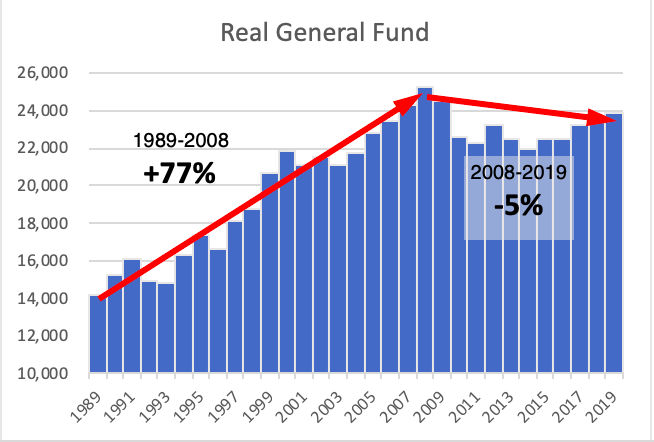
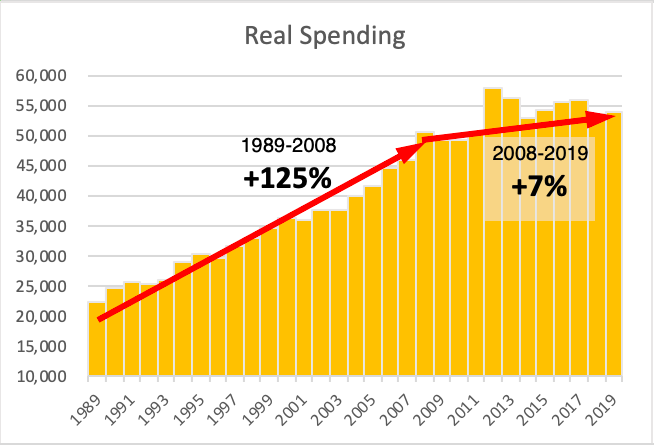
State spending, adjusted for inflation, grew 2.9 percent per year over the 20 years from Fiscal Year (FY) 1988-89 through the final pre-recession budget in FY 2007-08. (see chart below titled Real Spending). Appropriations fell 4.1 percent per year through FY 2010-11, but federal funds offset most of that decline, and total spending fell just 0.2 percent per year over that time. Even the lower level of appropriations depended on a one-cent sales tax increase. (see chart below titled Real General Fund).
During the 1990s, inflation-adjusted appropriations grew 4.0 percent per year even as Gov. Jim Hunt and the Republican General Assembly cut taxes, notably eliminating the sales tax on groceries between 1996 and 1999. The 2000s had slower growth of 2.6 percent per year, but Gov. Mike Easley resorted to underfunding state employees’ retirements and raising both income taxes and the sales tax rate. Those tax increases were supposed to be temporary when first passed in 2001 but were each extended twice. A quarter-cent of the sales tax increase expired in 2007, but the other quarter-cent was made permanent.
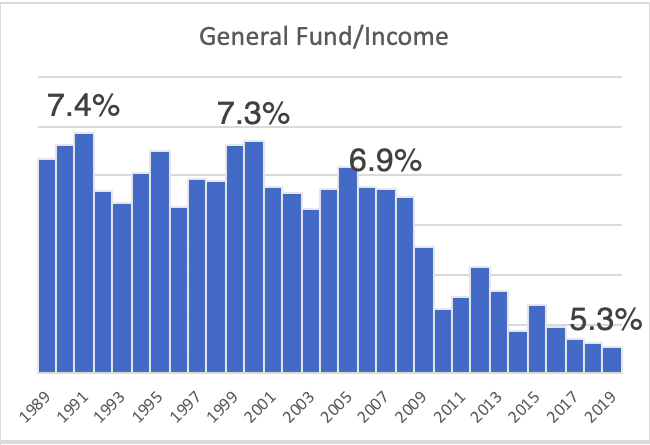
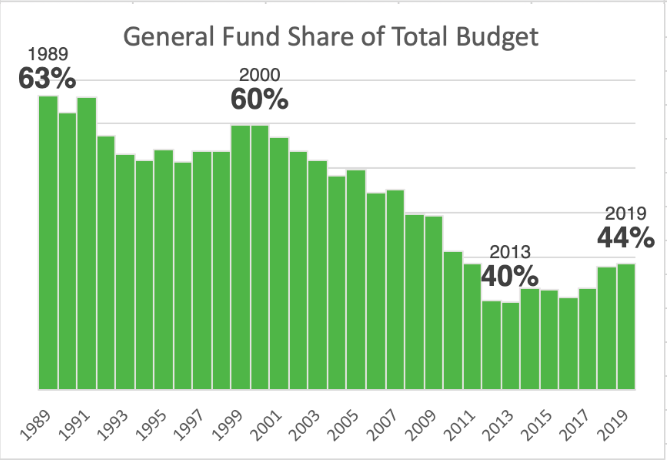
Appropriations as a share of income averaged between 6.0 and 7.5 percent of personal income before the recession, but have been closer to 5.5 percent since 2009, and are on a slight downward path as incomes continue to grow. (see chart below titled General Fund/Income). Appropriations also make up a smaller portion of total spending. From 60 percent or more in the 1990s, appropriations were displaced first by federal funds and later by the lottery as a source of funding for state government. (see chart below titled General Fund Share of Total Budget).
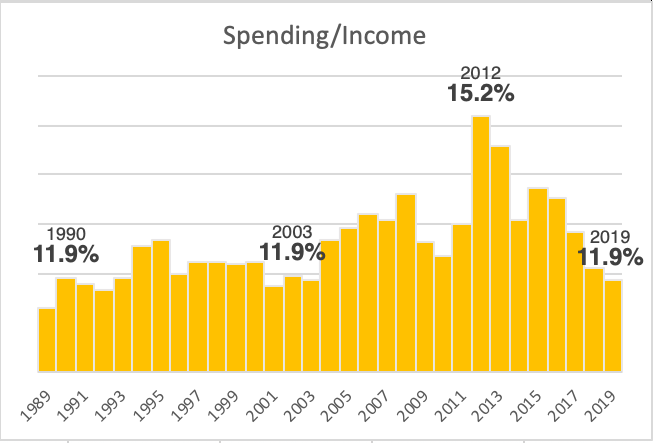
Since bottoming out in FY 2012-13 at 40 percent of total spending, appropriations have climbed back to 44 percent. Total spending, adjusted for inflation, peaked in FY 2011-12 when it reached 15 percent of personal income. It has since retreated to the 12 percent of income that was the rule until FY 2002-03. (see chart below titled Spending/Income).
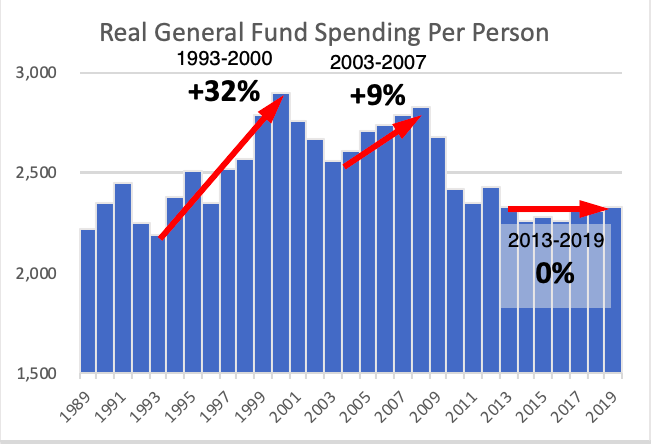
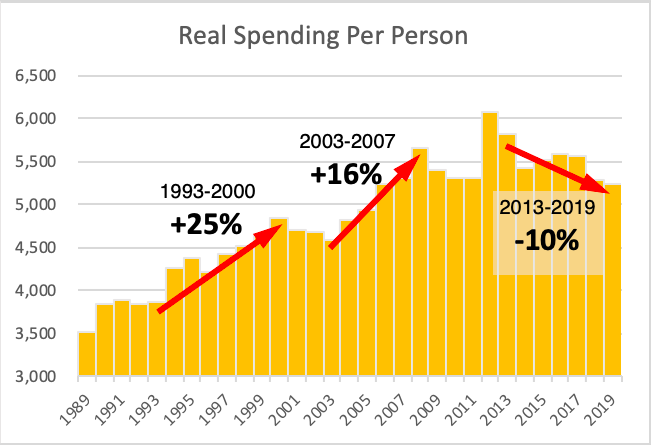
General Fund appropriations per person have been flat since FY 2012-13, (see chart below titled Real General Fund Spending Per Person) and total spending per person from all sources is down 10 percent. (see chart below titled Real Spending Per Person). The current trends are bringing North Carolina’s spending closer to its more traditional pattern of growing in line with population and inflation.
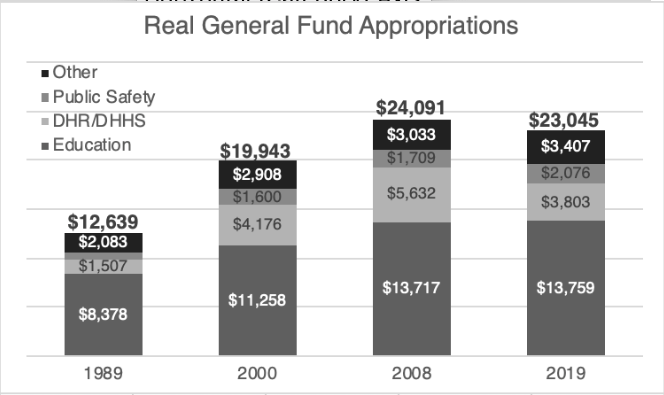
Education spending climbed 64 percent in real terms but fell as a share of General Fund appropriations from 66 to 57 percent between FY 1988-89 and FY 2007-08, the last budget before the recession. Public safety spending grew 155 percent, and Medicaid led 274 percent growth in health and human services spending, which expanded from 12 percent of appropriations to 23 percent. Overall spending, after inflation, grew 58 percent.
Through the fiscal year that ended June 30, 2019, inflation-adjusted education spending was flat, health and human services spending was down 32 percent, and public safety spending was up 21 percent. Overall, inflation-adjusted appropriations were down 4 percent. As a result, education was again back to 60 percent of General Fund appropriations, public safety had reached 9 percent, and health and human services had fallen back to 17 percent of appropriations. (see chart below titled Real General Fund Appropriations).
These trends call into question the standard stories about the General Assembly starving education and the fiscal wisdom of expanding Medicaid, with or without work requirements. Even with restrained spending, North Carolina is improving as a destination for teachers as the General Assembly has targeted spending on education and public safety.
