Weekly John Locke Foundation research division newsletter focusing on environmental issues.
The newsletter highlights relevant analysis done by the JLF and other think tanks as well as items in the news.
1. A set of facts on NC sea level rise that the alarmists are not refuting
The note below was written by David Burton in response to a blog post by William Chameides, Dean of Duke’s Nicholas School of the Environment. If there were errors in Burton’s analysis surely Chamedes would point them out, don’t you think? As you will note at the link above, the Dean had a snarky response suggesting that there were many errors in Burton’s analysis without identifying even one.
Climate Movement activists are pushing scientifically ungrounded policies, which would have severe economic consequences for North Carolina. This bill represents "push-back," to force policymakers to conform policy to what the science really tells us about sea level rise.
Mankind has been driving up CO2 levels substantially for about 3/4 century. We’ve raised average outdoor CO2 levels from about 300 ppm to nearly 400 ppm. (Indoor levels are often several times that.) But over that time period, the rate of sea level rise hasn’t increased at all.
NC’s best tide gauge is the GLOSS-LTT gauge at Wilmington, which has been measuring sea level continuously since 1935. Over it’s full history, the rate of sea level rise at Wilmington has averaged a glacially slow 2mm/year (about 8 inches per century).
Here’s NOAA’s graph of the full Wilmington sea level record, juxtaposed with a graph of CO2 level:
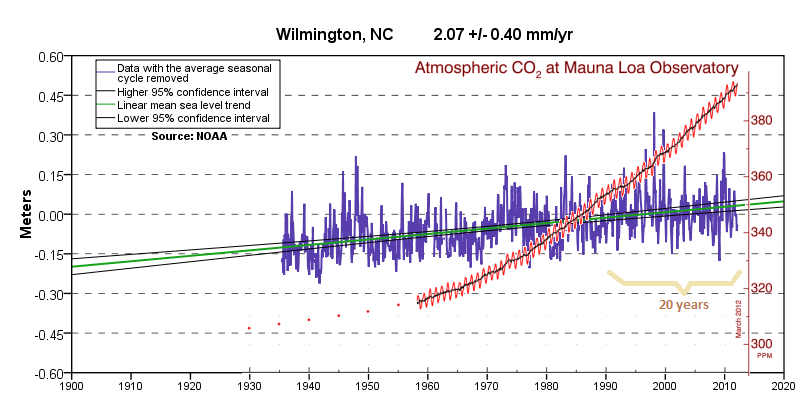
CO2 levels are in red, and sea level is in purple. If CO2 were driving sea level rise, then the purple graph would curve upward at the right-hand end,like the CO2 graph. (Click on the graph for a larger version.)
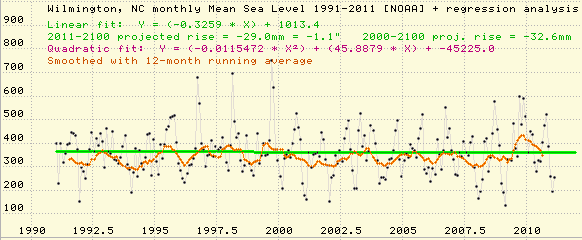
But over the last 20 years, sea level hasn’t gone up at all at Wilmington. That’s right: sea level rise at Wilmington, averaged over the past 20 years, is zero:
There are hundreds of high-quality tide gauge records around the world measuring sea level.Because the crust of the Earth is constantly moving, these tide gauges show widely varying rates of sea level change. At some locations, sea level is rising, at others it is falling, but the average is a very slight increase of between 1 and 2 mm/year. (The geographically-weighted average of the sea level trends at 159 NOAA-selected GLOSS-LTT gauges is +1.1 mm/year.)
Most of these tide stations show no evidence of any acceleration (increase) in the rate of sea level rise over the last 3/4 century. Some (like Wilmington) show slight decreases, others show slight increases, but the best studies indicate that there has been no increase in the average rate of sea level rise around the world, and most of the best studies show a slight decrease.
In other words, all that additional CO2 in the atmosphere hasn’t increased the rate of sea level rise at all.
We also have 19 years of satellite altimeter measurements of sea level over the open ocean. That’s too short to draw definite conclusions, and there are major problems with the quality of the satellite data, but it is nevertheless worth noting that, like the tide gauge measurements, the satellites seem to show that as CO2 levels go up, the rate of sea level rise is decreasing, rather than increasing:
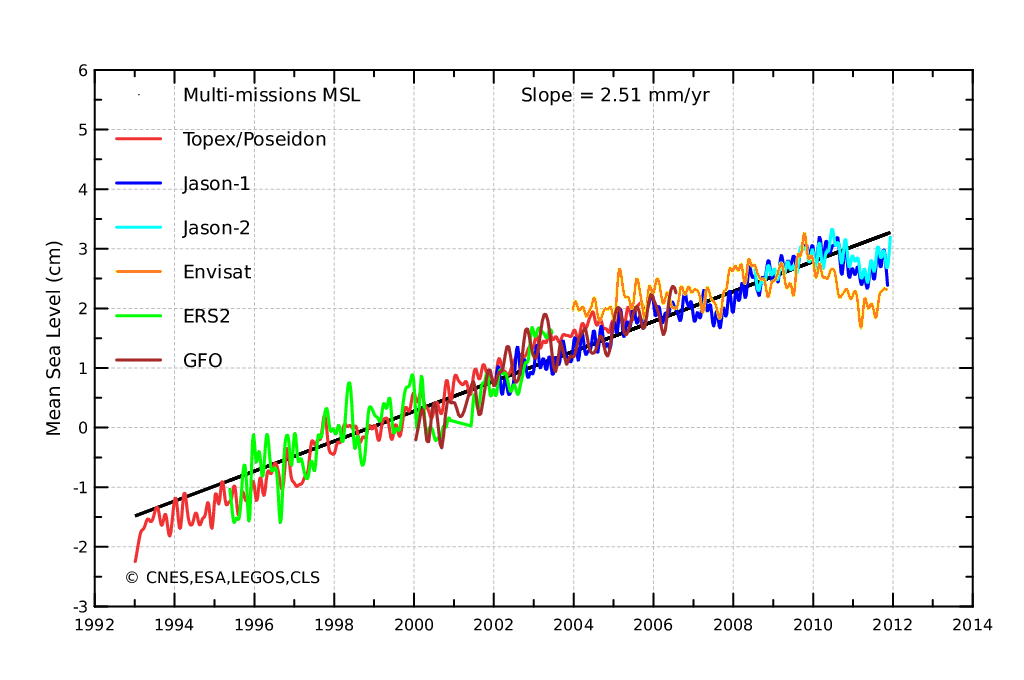
For years, Climate Movement alarmists have been predicting that, as a result of what MIT climatologist Richard Lindzen calls "gross exaggerations of highly uncertain computer projections combined into implausible chains of inference," higher atmospheric CO2 levels should cause the rate of sea level rise to increase dramatically. But the data contradicts that prediction.
We’ve done the experiment and we know the result. When mankind began driving up atmospheric CO2 levels (with dramatically beneficial effects on agriculture)the post-LIA acceleration in rate of sea level rise ceased. The last ~3/4century of increasing CO2 levels and emissions have caused no increase at all in the rate of sea level rise. It is irrational and unscientific to expect that repeating that experiment over the next 3/4 century will have a significantly different result. The best prediction for sea level in the future is simply a linear projection of sea level in the past. For the southern NC coast, that’s a measly 7 inches of sea level rise by 2100 (and a little over twice that for the northern NC coast, due to land subsidence there).
Regulatory rulemakers create a type of "law" which impacts citizens just as much as bills passed by the Legislature, but often with considerably less direct citizen input than is possible when laws are enacted by legislators who must stand for election every two years. There’s real danger that rulemakers, under pressure from special interest groups, will subordinate geophysical science to political science, codifying scientific nonsense into North Carolina’s body of rules and regulations.
Nobody should want that! This year, the DENR is dominated by Democrats and the NCGA by Republicans. But in a few years it might be the other way around! I think that the rulemakers should conform NC’s rules regarding land development, setbacks,structure elevation, insurance, etc., to actual scientific evidence, rather than to the political winds of the day. Don’t you?
I recently wrote an article about sea level for J. Natural Hazards. The topic was NY sea levels rather than NC sea levels, but, just as a rising tide lifts all boats, non-accelerating sea level rise in NY is non-accelerating sea level rise in NC.
By the way, do you know how long a sea level record needs to be to establish a robust trend? About 60 years; 50 at the very least! That’s what the research tells us.See:
- Douglas, B. (1995). Global sea level change: Determination and interpretation. Reviews of Geophysics 33(S1). issn:8755-1209.
- Jevrejeva, S., J. C. Moore, A. Grinsted, and P. L. Woodworth(2008), Recent global sea level acceleration started over 200 years ago?, Geophys. (and here).
- Believe it or not, even the deeply flawed 2010 CRC Science Panel report admitted (p.6) that, "tide gauges [which] don’t extend back in time more than 50 years [make] it difficult to resolve changes in the rate of rise over the decades" (though they then went on to use a 24year record in preference to an available 75 year record)
Dr.Nicola Scafetta (Duke U.) made this point (in private communication): "…an interval of just 30 years is the worst that can be chosen because it is half 60-year cycle, and it happened that for SLR the period 1975-2005 had this 60-year cycle during its warming phase (the temperature warming phase was about 1970-2000). So, if you fit the last 30-40 years you get an overestimation of the real trend."
Yet the CRC Science Panel’s 2010 Report (which recommended a 39 inch SLR projection)used just 24 years of data from a tide gauge at Duck, NC that is severely affected by land subsidence, even through there was an excellent 75 year record available for Wilmington, the only GLOSS-LTT tide gauge in NC. That was just one of the errors in their Report, and not the worst one, unfortunately.
Dave Burton
member, NC Sea Level Rise Impact Study Advisory Committee
IPCC AR5 WG1 Expert Reviewer
NC-20 Science Advisor
2. Commission sealevel rise prediction not useful for rigorous policy analysis
Over the last week we have heard a lot about the prediction of the N.C.Coastal Resources Commission’s Science Panel on Coastal Hazards, an effort supported by the NC Department of Environment and Natural Resources. The exchange discussed above is part of the rancor that has ensued. As noted, the panel’s prediction is sea level along the coast of North Carolina will rise 1meter, or 39 inches, by the year 2100. As an economist, I cannot offer an expert opinion about the commission’s science, but I hope it is more rigorous than its statistics. The panel’s prediction lacks necessary statistical rigor and is therefore not very useful for serious policy analysis. It makes a prediction but assigns no probability to it other than to say that it is "likely,"while giving no rigorous, i.e., quantitative, definition of what "likely"means. In fact, the commission specifically states:
The Science Panel does not believe,based on the data available at this time, that it is appropriate to attempt to quantify confidence intervals or margins of error
This makes the prediction useless for conducting rigorous economic cost-benefit analysis, which should be the basis for public policy. If you can’t use the prediction in a rigorous sense for determining whether the benefits to society of a particular policy proposal or regulation outweigh the costs, then it is not a very good prediction for the purposes that I presume DENR had in mind when commissioning the report, i.e. formulating policy.
We have been hearing a lot this week about the science of all this and who has credentials and who doesn’t, but the bottom line question is one of economics not science. Of course the economic analysis must be informed by scientific analysis. Unfortunately, the scientific commission did not provide enough information to conduct an informed, rigorous economic assessment. This would require a prediction that is associated with a quantifiable probability statistic.
3. Ozone Report
The2012 ozone season began on April 1 and each week during the ozone season this newsletter will report how many, if any, high ozone days had been experienced throughout the state during the previous week, where they were experienced, and how many have been recorded during the entire season to date. The ozone season will end on October 31st. All reported data is from the North Carolina Division of Air Quality, which is part of the state’s Department of Environment and Natural Resources. During the period June 4th to10th there were no reported high ozone readings on any of the state’s monitors.There have been no high ozone days thus far this season.
Click here for the Environmental Update archive.