- To find the partisan leanings of North Carolina’s new congressional districts, we used methods like those used in the Civitas Partisan Index
- The congressional map drawn by court-appointed special masters is a Democratic protection plan that will shield them from a likely “red wave” election this year
- Other factors, such as incumbency and candidate quality, also influence who wins in congressional districts
With the dust finally settled on the latest (but certainly not last) round of North Carolina’s redistricting wars, we can take stock of how those districts could perform in the next election. We have already measured the partisan leanings of General Assembly districts. This brief will examine congressional districts drawn by a group of three court-appointed special mastersfor the 2022 election.
How Do We Know the Partisan Leanings of North Carolina’s Court-Written Congressional Districts?
To find the partisan leanings of North Carolina’s congressional districts, we used a similar methodology to that of the John Locke Foundation’s Civitas Partisan Index (CPI).
We took precinct-level results of the ten 2020 Council of State races using data from the North Carolina State Board of Elections (NCSBE) precinct sort files. We then assigned each precinct to a congressional district based on the map written by court-appointed special masters in North Carolina League of Conservation Voters v Hall. The Republican votes of ten races were added together in each state legislative district and divided by the total two-party votes for those ten races to get a Republican percentage in each district.
One difference between the methodology of Locke’s assessment of the partisan leanings of congressional districts and the CPI is what we use as a baseline. In the CPI, the Republican percentage is then subtracted from the Republican statewide average for those ten races (50.76%) to find the CPI rating for each district. We did not think that baseline is justified for congressional races since they are higher on the ballot than Council of State races and have a higher turnout. We believe the Council of State races are still good for finding the baseline partisan tendencies of precincts, however.
Instead, the partisan lean for congressional districts is how far that district’s baseline partisanship differs from an even split. For example, the 1st Congressional District is 55% Democratic and is assigned a partisan lean of D+5.
Court Imposed a Democratic Protection Redistricting Plan
We also assigned a rating to each district based on its partisan lean. We rate districts with a partisan lean of 0–1 in either direction as a toss-up, 2–5 as a lean, 6–9 as likely, and 10 or more as a safe seat for the particular party. The partisan leans and ratings for every congressional district are in Table 1.
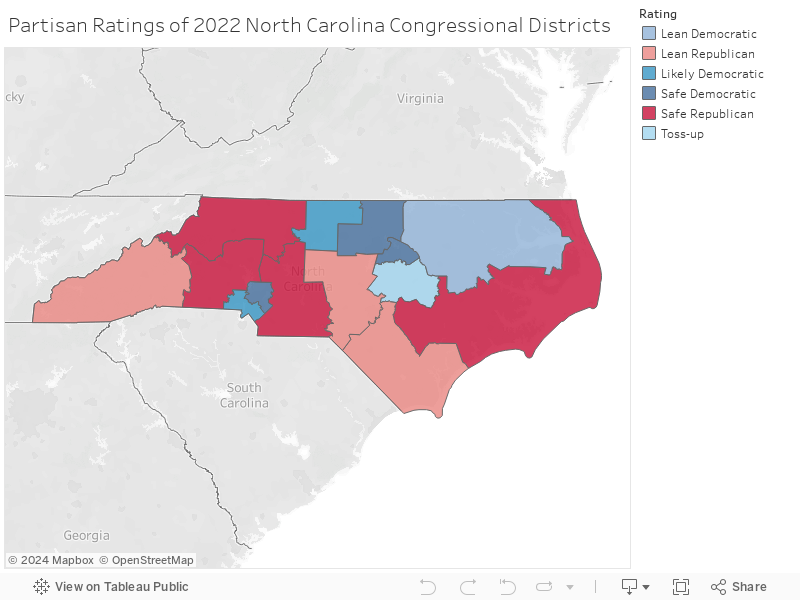
Figure 1: Partisan Ratings of Interim North Carolina Congressional Districts

The map is more favorable to Democrats than … a map drawn using politically neutral criteria.
The partisan advantage of the court-drawn map is split evenly between the major parties, 7-7. It can also be considered a 7-6-1 Republican map since the single toss-up district, the 13th, is D+1. The next most competitive district is the 9th, which is R+3. That means the most realistic outcomes from this map range from 8-6 Democratic to 8-6 Republican. That is in stark contrast to a remedial map offered by the General Assembly with four competitive districts.
It is also more favorable to Democrats than you would expect from a map drawn without using partisan data to benefit one party. Dr. Jowei Chen, an expert witness for the plaintiffs in the case that led to the original congressional map being overturned, found that the most likely outcome for a map drawn using politically neutral criteria was 9-5 Republican (see pages 32-33 of Chen’s report).
Other experts also found that the court-drawn districts “would have more safe seats for Democratic candidates, and fewer tossup seats than the map the Republican-led legislature had drawn.” But 2022 is shaping up to be a “red wave” election year. Whatever the intent of the special masters who drew North Carolina’s congressional districts, the effect of their effort is a Democratic protection plan that will likely spare them from the worst of an expected red wave this fall.
The 1st District could also be competitive, but only if this fall’s expected red wave becomes a red tsunami.
Figure 2: Interactive Map of North Carolina Congressional Districts
Baseline Partisan Leanings Is But One Factor in Election Outcomes
Congressional partisan leanings provide a baseline measure for each district’s performance, all other things being equal. Of course, all other things are rarely equal. Other factors such as incumbency, candidate quality, and the general political environment (such as the expected red wave this year) also affect election outcomes in every district. Knowing the baseline tendencies of districts will help you understand which districts could be flipped due to those other factors and which likely could not.