- The Civitas Partisan Index (CPI) measures the partisan leanings of North Carolina state legislative districts
- The CPI ratings indicated that Republicans start with a near-majority of safe and likely seats in both chambers
- While not a prediction model, the CPI is accurate, and readers can use it to learn more about state legislative races this year
UPDATE: This CPI is for districts that the North Carolina Supreme Court overturned in February of 2022. Click here for the CPI of new court-ordered districts that will be used in the 2022 election.
The North Carolina General Assembly approved state legislative (and congressional) districts on November 4. To help people understand how those districts will likely affect the political landscape, we are releasing the 2022 Civitas Partisan Index (CPI) for the NC House and NC Senate districts.
How We Measure the Political Leanings of North Carolina Legislative Districts
The CPI is modeled after the Cook Political Report’s Partisan Voting Index. It is a measure of the base partisan leanings of a North Carolina state legislative district compared to the state as a whole. For each district, the CPI score lists the party (identified by initial, D or R) the district tends to favor followed by a number indicating the relative lean of the district toward that party. For example, a district that tends to vote about 7 percent more Democratic than the state average would have a CPI score of D+7.
The 2020 CPI took precinct-level results of the ten 2020 Council of State races using data from the North Carolina State Board of Elections (NCSBE) precinct sort files. The Republican votes of ten races were added together in each state legislative district and divided by the total two-party votes for those ten races to get a Republican percentage in each district. That percentage is then subtracted from the Republican statewide average for those ten races based on the NCSBE elections data (50.76%) to find the CPI rating for each district. For example, the average Republican percentage in the 1st state Senate district was 52.55%, which was 1.79 percentage points above the statewide average, resulting in a CPI score of R+2 (52.55 – 50.76 = 1.79, rounded up to 2).
The 2020 Council of State races used in the CPI were for governor, lieutenant governor, commissioner of agriculture, commissioner of insurance, commissioner of labor, attorney general, secretary of state, superintendent of public instruction, state treasurer, and state auditor.
The Partisan Leanings of the New North Carolina House and Senate Districts
We also assigned a rating to each district based on its CPI score. Districts with a CPI of 0–1 in either direction are rated as toss-up, 2–5 as lean, 6–9 as likely, and 10 or more as safe seats for the respective parties. Districts with a 0 rating have a partisan lean of less than half a percentage point.
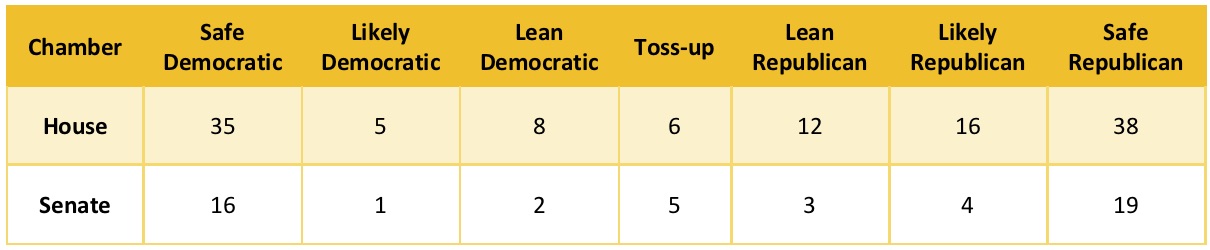
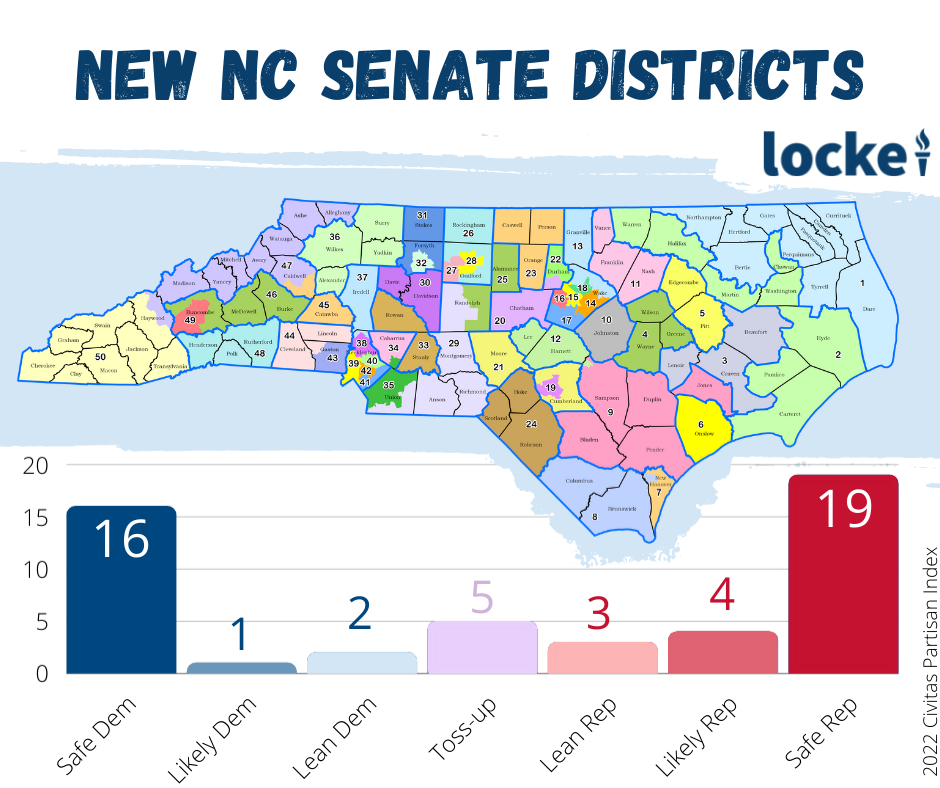
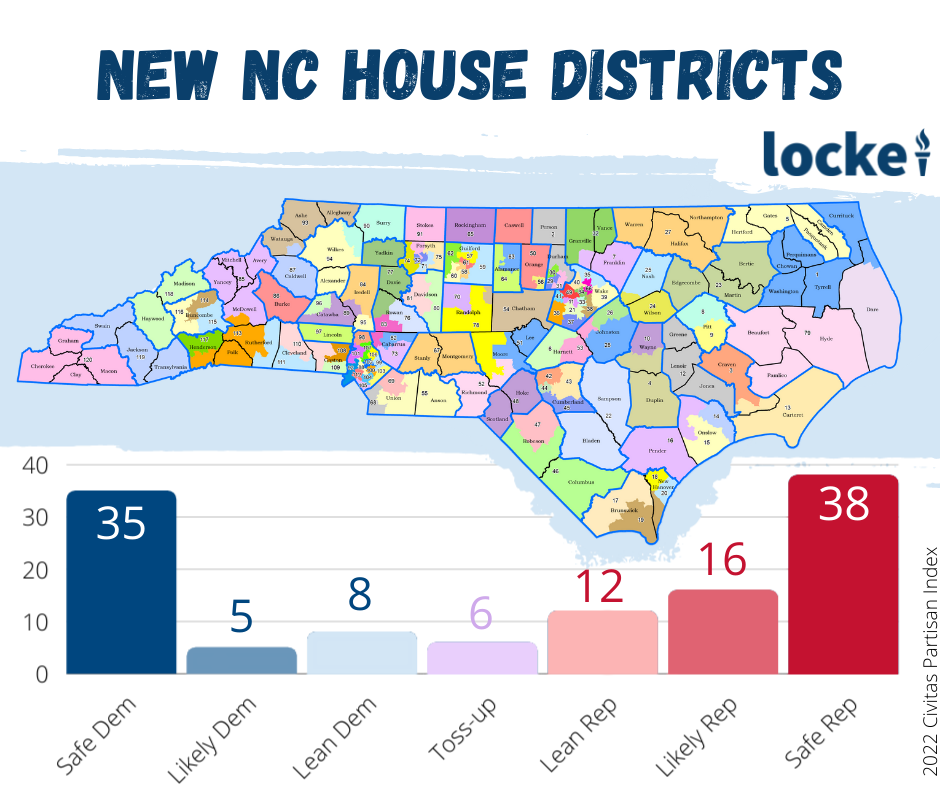
There are 50 seats in the North Carolina Senate and 120 in the North Carolina House. The CPI indicates that there are 16 safe Democratic, 1 likely Democratic, 2 lean Democratic, 5 toss-up, 3 lean Republican, 4 likely Republican, and 19 safe Republican seats in the Senate. In the House, there are 35 safe Democratic, 5 likely Democratic, 8 lean Democratic, 6 toss-up, 12 lean Republican, 16 likely Republican, and 38 safe Republican seats.
The partisan tendencies of House and Senate Districts are displayed in Table 1. Here are the spreadsheets for each chamber:
Table 1: Partisan ratings of North Carolina House and Senate districts based on their Civitas Partisan Index Scores
So, Republicans would start with 23 likely or safe seats in the Senate in a typical election and would just have to pick up the three lean-Republican seats to secure a majority. They could gain a 30-seat supermajority (the three-fifths need to override gubernatorial vetoes) by picking up four of the five toss-up districts. The Democrats would have a tougher row to hoe. They would have to win all of the seats that tend toward Democratic candidates, all five toss-up seats, and two Republican-leaning seats to secure a simple majority.
It is a similar story in the House. Republicans could gain a 66-54 seat majority simply by holding on to all the seats that tend their way and could get the 72 seats they need for a supermajority by picking up the six toss-up seats. Democrats would have to pick up all the seats that tend their way, all the toss-up seats, and five Republican-leaning seats to secure a majority.
How to Use the CPI
The CPI is not a tool for predicting races, since it does not include measures such as incumbency or measures of candidate quality such as funds raised. However, someone using the CPI without any other data would have successfully predicted 90 percent of state legislative races in 2018 and over 94 percent of races in 2020.
The CPI measures the general tendency of voters in a district to vote for one party or the other. By doing so it creates a baseline measure that journalists, researchers, and others can use when examining North Carolina legislative races. By using the CPI, you can get important insights into the 2022 election.