[See an update below on the shaky constitutional ground of the special masters’ congressional map.]
A three-judge panel of the Wake County Superior Court issued its ruling in a set of redistricting cases today. The court accepted the North Carolina House and Senate plans but rejected the congressional district plan.
Since the court accepted the General Assembly’s state legislative maps, it ignored maps from the plaintiffs: “the Court did not need to consider an alternative plan for adoption” (page 19).
Governor Cooper came out against the Senate map, a signal to the Democratic majority on the North Carolina Supreme Court to reject it when plaintiffs appeal. The House map, which is friendlier to Democrats than what they likely would have gotten under maps drawn using politically neutral criteria, will probably be unchallenged.
The Real Drama Is with the Congressional Map
I have previously noted that the most likely result of a congressional map drawn using politically neutral criteria was 9-5 Republican (with 8-6 Republican being a close second). The remedial map passed by the General Assembly was an 8-6 Republican map or a 6-4-4 map with four very competitive districts.
The Court rejected the remedial congressional map based on the claims of three special masters that it did not meet either of the thresholds of having no more than 7% efficiency gap or no more than 1% median-mean difference suggested by the Supreme Court. Analyzing the remedial map through a composite of 2016 and 2020 races finds an efficiency gap of 6.37%R and a median-mean score of 0.66%R. We will have to wait until the court’s full report comes out to see how the special masters came to their conclusion.
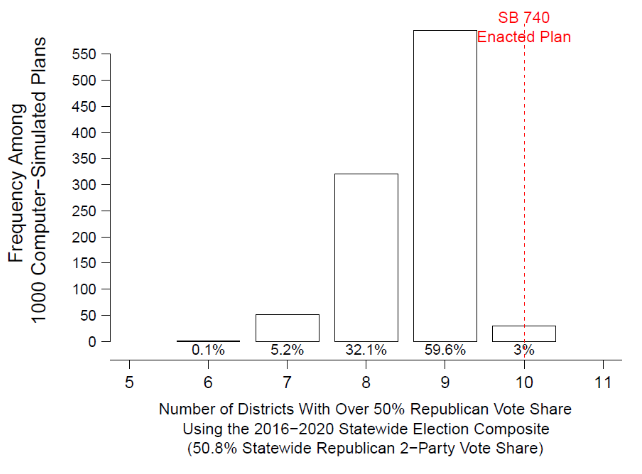
With that, the three special masters, including “nonpartisan” member former judge Bob Orr (who has left the Republican Party and now targets it), took it upon themselves to draw a new map. The result is a 7-7 map with only two competitive districts. That result is improbable in a map drawn using nonpartisan redistricting criteria. For example, Dr. Jowei Chen, a witness for the plaintiffs in the redistricting case, found only a 5.3% chance of getting an outcome so favorable to Democrats (see Figure 1).
What it does is protect Democrats from what is expected to be a Republican wave election this fall.
Figure 1: Likelihood of North Carolina congressional map outcomes by Dr. Jowei Chen. The chart is on page 33 of Chen’s report.
It is also easy to see the primary way Orr and the other special masters achieved that unlikely outcome. They took a meat cleaver to Charlotte, splitting the city down the middle. They then grafted half onto suburban Gaston County and the other half (along with most of suburban Mecklenburg County onto Cabarrus County. Their map does not even meet the minimum community of interest standard of having a congressional district whole contained in Mecklenburg County.
The cleaving of Charlotte alone should have been enough for the court to reject the special masters’ map.
Interestingly, while the special masters’ map has a very low efficiency gap of 0.63%R, its median-mean score of 0.69%R is higher than the remedial map’s score of 0.66%R.
Even the special masters’ congressional map survives the litigation process it will last exactly one election cycle before being replaced in 2024.
Update: The Shaky Constitutional Ground under the Special Masters’ Map
Examining differing conclusions of the experts contracted by the special masters on median-mean and efficiency gap scores of the General Assembly’s remedial congressional map is revealing.
- Eric McGhee basically ran the various plans on Planscore and found an efficiency gap of 6.4%R and a median-mean score of 1.1%R. I replicated his results.
- Tyler J. Jarvis ran an ensemble of 11 races from 2016 and 2020. He found that the General Assembly’s remedial map had an average efficiency gap of 8.8%R and an average median-mean score of 0.9%R.
- Bernard Grofman (not currently directly linkable) found the General Assembly’s remedial map had an efficiency gap of 6.37%R and a median-mean score of 0.66%R. Grofman also noted his bias against accounting for the natural geographic sorting that leads to differences in district election results without gerrymander (in essence calling for gerrymandering to correct for political geography).
- Sam Wang (yes, that Sam Wang) had two sets of measures. One found the General Assembly’s remedial map had an efficiency gap of 6.8%R and a median-mean score of 1.2%R while the other found an efficiency gap of 7.4%R and a median-mean score of 0.7%R.
While there are other measures people claim detect gerrymandering, the efficiency gap and mean-median score are two of the most widely used. The people hired by the special masters are all over the board on those two measures with results sometimes falling within the parameters set by the court and sometimes not. That is shaky ground for the court to usurp the legislature’s authority to draw congressional districts set in both the North Carolina and the United States constitutions.
While the North Carolina Supreme Court upheld the special masters’ map for the 2022 election, it will surely be replaced by 2024.