Background: Duke Energy Progress, LLC and Duke Energy Carolinas, LLC (jointly, “Duke”) recently filed its Carolinas Carbon Plan with the North Carolina Utilities Commission (UC) as directed by House Bill 951, passed into law in 2021. The Duke plan includes four alternative portfolios for achieving the two phases of CO2 emissions, a reduction by 2030 (or thereabouts) in North Carolina’s carbon dioxide (CO2) emissions from energy generation by 70% from where they were in 2005, and “carbon neutrality” by 2050.
Crucially, the law (see discussion here, here, here, and here) requires that the plan approved by the UC must, with emphasis added:
• be “reasonable“
• set forth the “least cost path … to achieve compliance”
• comply with “current law and practice” regarding “least cost planning of generation“
• “maintain or improve upon the adequacy and reliability of the existing grid”
Portfolio 3
This post discusses Portfolio 3 of the four Duke portfolios. It evaluates it according to standards required by law of the UC. Also, North Carolina state law has historically required that electricity provision be least cost and reliable. That requirement is of the utmost importance because (a) people have no choice over who provides them electricity at what cost, (b) electricity is a basic necessity of life, and (c) energy poverty can be deadly and is already serious in North Carolina.
Portfolio 3, like the other three portfolios, would rely heavily on new solar, but it ties with Portfolio 4 for the largest proposed addition of new nuclear capacity and would be less reliant on wind.
Capacity
By 2050, Portfolio 3 would:
- retire 9,300 megawatts (MW) of coal (6,300 MW by 2035)
- add 19,000 MW of solar (10,500 MW by 2035)
- add 1,800 MW of onshore wind (1,200 MW by 2035)
- add 6,400 MW of battery storage (2,500 MW by 2035)
- add 2,400 MW of combined cycle natural gas, all by 2035
- add 7,500 MW of combustion turbine natural gas/hydrogen (1,200 MW by 2035)
- add 10,200 MW of nuclear (600 MW by 2035)
- add 1,700 MW of pumped storage, all by 2035
Under Portfolio 3, the amount of installed capacity on North Carolina’s electric grid would increase from 36.3 gigawatts (GW) in 2021 to 50.4 GW by 2035 (38.8%) and increase to 68.0 GW by 2050 (87.3%), representing a near doubling of the amount of installed capacity on Duke Energy’s electric system — and closer to triple the rate of growth of North Carolina’s population (expected to grow by only 31.6% during that time).
Deliberate overbuilding
The reason for so much new capacity is the deliberate use of weather-dependent resources of solar and wind. They are unreliable, intermittent, and nondispatchable. To use solar and wind in replacing dispatchable thermal capacity on the grid means significant overbuilding to meet peak demand during periods of low wind and solar output. Deliberate overbuilding imposes additional costs on consumers, including spreading fixed costs across fewer megawatt-hours (MWh) of production, additional load-balancing costs, higher property taxes, and curtailment costs (when the wind isblowing and sun shining) that effectively lower the capacity factor of all wind and solar facilities and greatly increases the cost per MWh produced.
Cost and Consumer Impacts
Portfolio 3 would cost $141.7 billion through 2050, much of which would occur after 2035. Those expenses include:
- $83.6 billion in utility returns
- $42.6 billion in additional generation costs
- $4 billion in transmission expenses
- $11.4 billion in additional property tax expenses
Rates would increase tremendously on all three classes of ratepayers. Here are those consumer impacts in brief:
Residential consumers
- Price increases: up 2.54 cents/kilowatt-hour (kWh) by 2035; up 7.72 cents/kWh by 2050
- Average monthly bill increases: up nearly $23 by 2035; up $86 by 2050
- Average annual increases: up nearly $275 by 2035; up over $1,030 by 2050
Commercial consumers
- Price increases: up 1.94 cents/kWh by 2035; up 5.87 cents/kWh by 2050
- Average monthly bill increases: up over $56 by 2035; up over $300 by 2050
- Average annual increases: up nearly $680 by 2035; up over $3,600 by 2050
Industrial consumers
- Price increases: up 1.34 cents/kWh by 2035; up 4.21 cents/kWh by 2050
- Average monthly bill increases: up about $8,200 by 2035; up nearly $23,300 by 2050
- Average annual increases: up over $98,400 by 2035; up nearly $279,400 by 2050
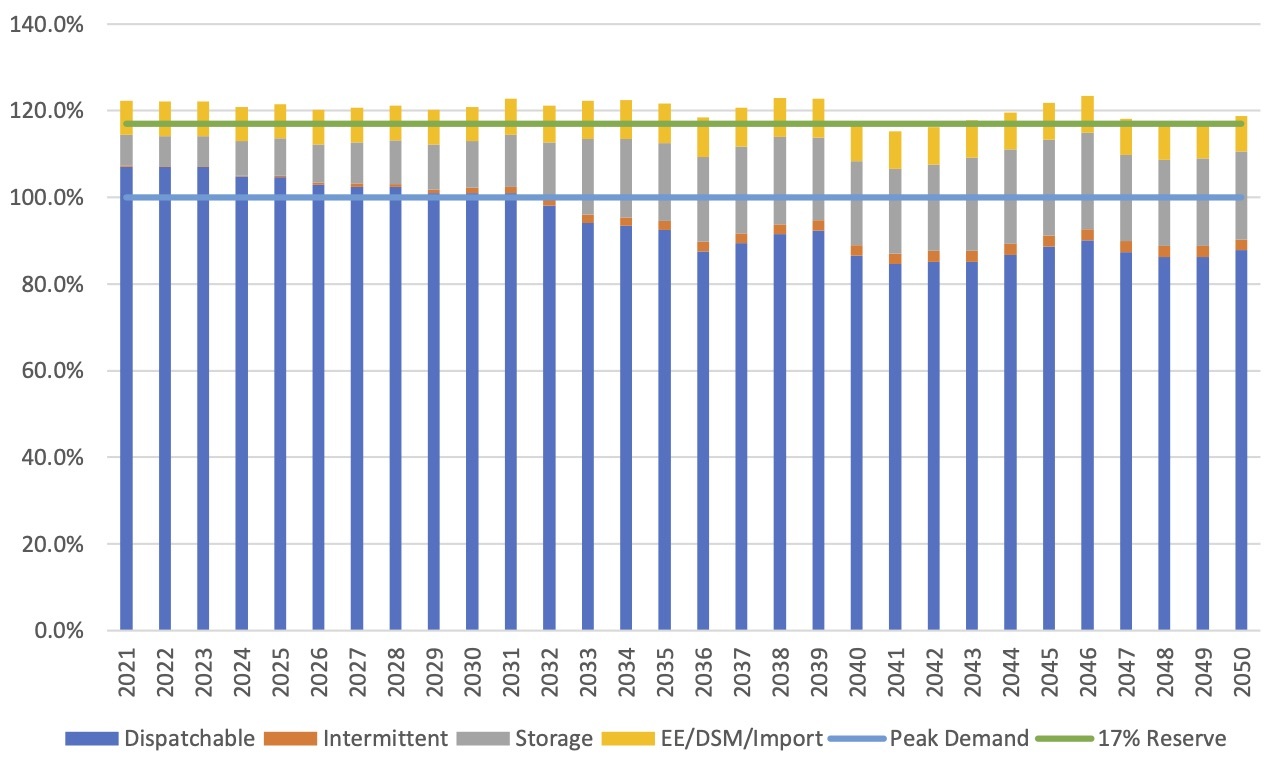
Reliability Impacts
An analysis of the Duke plans presented before the UC by the John Locke Foundation’s Center for Food, Power, and Life evaluated reliability of Portfolio 3 on an annual and hourly basis.
It showed that as soon as 2032 in the winter, when electricity demand is highest and power outages are deadliest, under Portfolio 3 Duke would not plan to rely on dispatchable baseload generation to meet net load. Instead, Duke would rely upon the accredited capacity of wind and solar, storage, and load management resources to meet net load.
Such reliance would be irresponsible because, as we learned in California and Texas, accredited capacities for wind and solar generation are not guaranteed. Overrelying on such technologies could result in capacity shortfalls. Storage systems charged with intermittent renewables are not guaranteed to be available when power is needed most, which would potentially leave the grid short of capacity during peak demand periods.
Duke Portfolio 3 Total Firm Capacity as a Percentage of Peak Demand
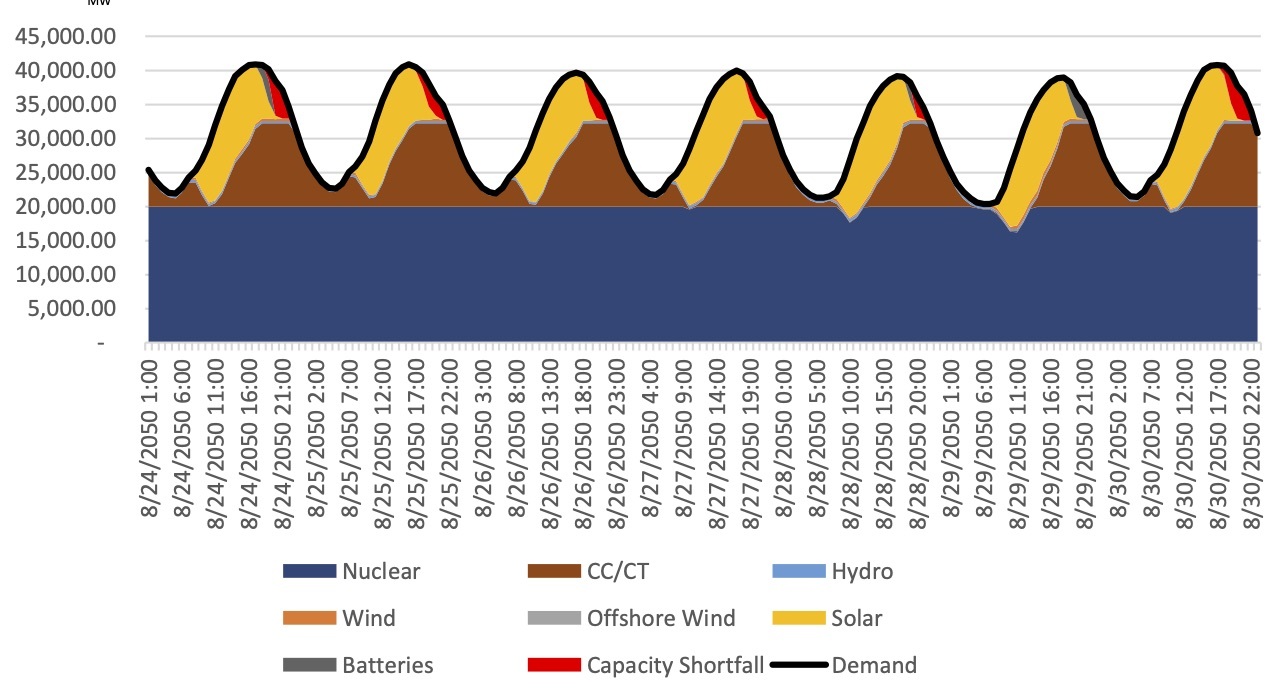
Meanwhile, under hourly load estimates during a model week in August (the height of summer) by 2050, Portfolio 3 of the Duke scenarios would experience capacity shortfalls. The analysis identified 32 hours across the week in which there would be insufficient capacity available to meet electricity demand, reaching over 6.3 MW and potentially triggering load shedding (i.e., rolling blackouts).
Duke Portfolio 3 Projected Hourly Load Shape, Capacity Shortfalls: August 24–30, 2050 (32 hours)
Other posts on the Duke portfolios are here: Portfolio 1, Portfolio 2, and Portfolio 4. More in-depth discussion of this portfolio and the other Duke portfolios can be found at the Center for Food, Power, and Life’s report, “Analysis of Duke Energy’s Carolinas Carbon Plan and a Least Cost Decarbonization Alternative.”