The John Locke Foundation recently released an analysis of North Carolina’s congressional districts using a methodology similar to our Civitas Partisan Index of state legislative districts.
The partisan leanings and district ratings created using our methodology differ from those used by some national organizations. One such national organization is FiveThirtyEight, one of the leading data-based journalism sources in the United States.
Figure 1 helps compare our analysis of the partisan leanings of North Carolina’s congressional districts with analyses from a couple of national programs. It has four columns. The first is Locke’s baseline partisan leanings for each district. The second column is a head-to-head comparison of the two-party outcomes for the district using Locke’s data and methodology, which is about twice as large as each district’s partisan lean. That rating allows for apples-to-apples comparisons with measures from FiveThirtyEight and Dave’s Redistricting, a popular online district mapping program.
As seen in Figure 1, FiveThirtyEight’s analysis produces some differences from Locke’s. The most glaring difference is for the 13th District. Locke finds it a D+1 toss-up, while FiveThirtyEight finds it R+3. The Cook Political Report similarly rates the 13th a “Republican Toss Up.”
Figure 1: Comparing Three Measures of the Partisan Lean of North Carolina Congressional Districts:
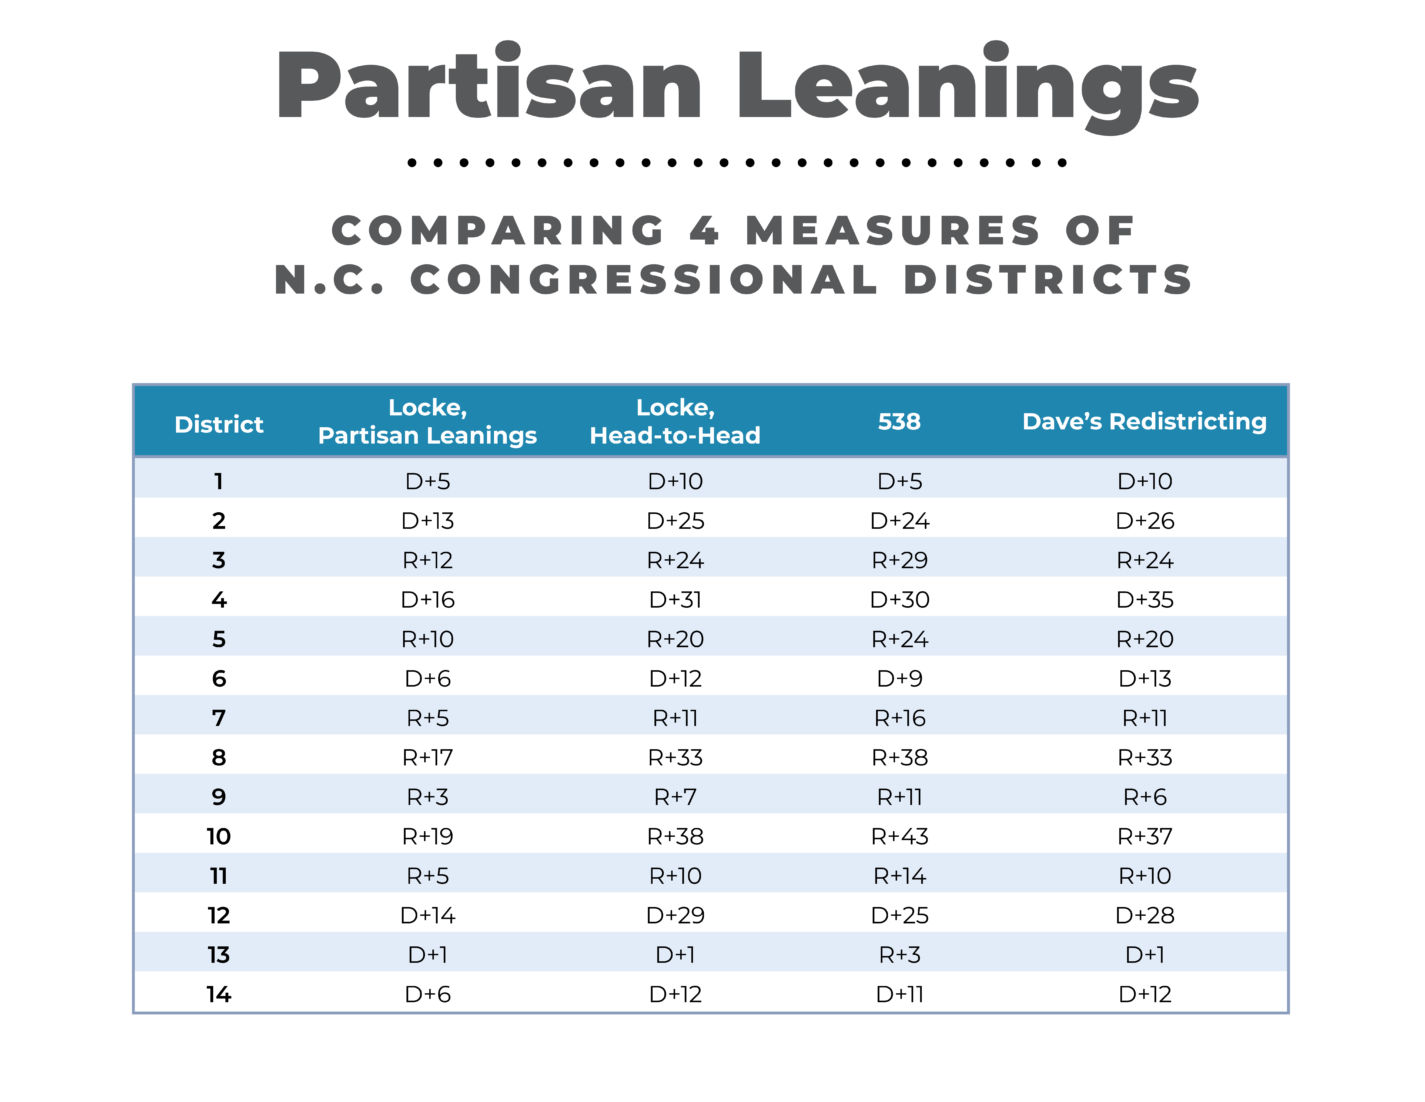
With some exceptions, the FiveThirtyEight district partisan leanings tend to favor Republicans about 3–5 percentage points more than the Locke leanings do. That is mainly due to the different data the measures used. FiveThirtyEight uses recent presidential popular votes for the baseline (as does Cook) and compares each district to the nation as a whole. Meanwhile, Locke uses data from the ten North Carolina Council of State races. Dave’s also uses North Carolina data but includes different races (such as the North Carolina vote for president) in its composite.
Locke and FiveThirtyEight’s partisan leanings are both accurate in what they measure. It is possible, for example, for the 13th Congressional District both have a slight baseline advantage to a Democrat who runs there and for it to be three percentage points friendlier to Republicans than the rest of the nation, based on recent presidential elections.
Which congressional district measure should you rely on for understanding the baseline tendencies of North Carolina’s congressional districts? Probably the one that uses only North Carolina data and does not include, for example, data from Long Beach, California.
For a fuller description of the methods we used to calculate the partisan lean of North Carolina’s congressional districts, see our brief on those district ratings.