This week, JLF’s Jon Sanders published a research brief on the North Carolina Education Lottery. According to Sanders, his results are very familiar:
In a 2007 Spotlight report, Joe Coletti showed that high property taxes, unemployment, and poverty rates are “the best guides to a county’s lottery sales per adult.” In my 2010 Carolina Cronyism report on the lottery, I made the same finding.
I looked into it again for our Agenda 2014 policy booklet and again made the same finding. Ditto for our North Carolina Policy Solutions 2018 booklet… I’m revisiting it again for our upcoming policy guide for 2020. The trend is unmistakable.
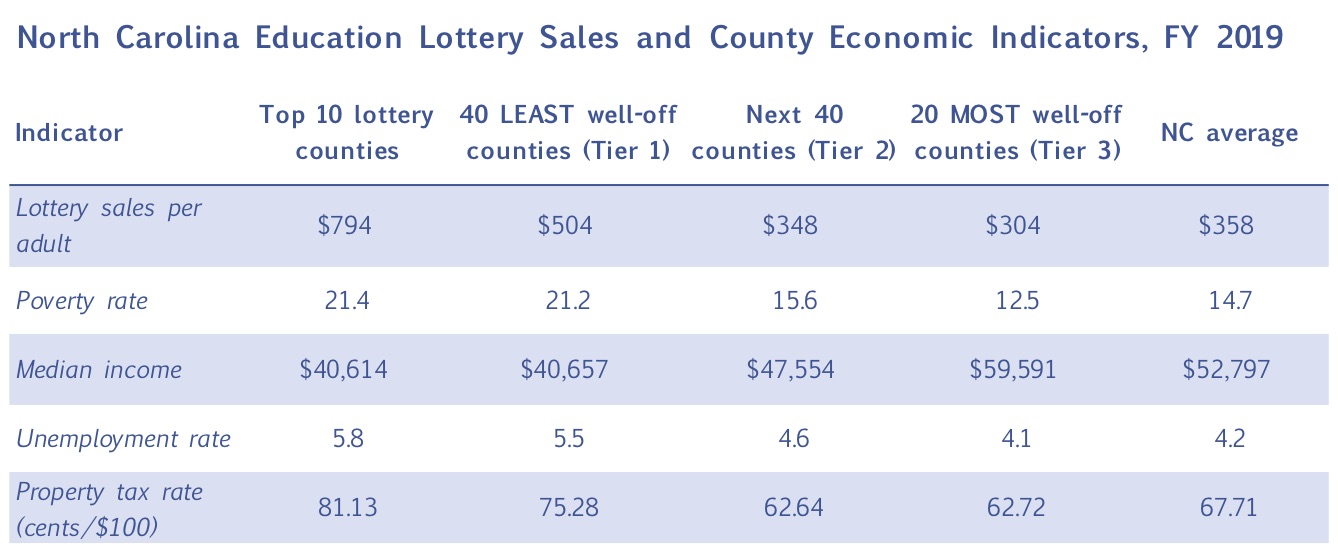
Sanders breaks down his results into lottery ticket sales into counties by affluence (see image).
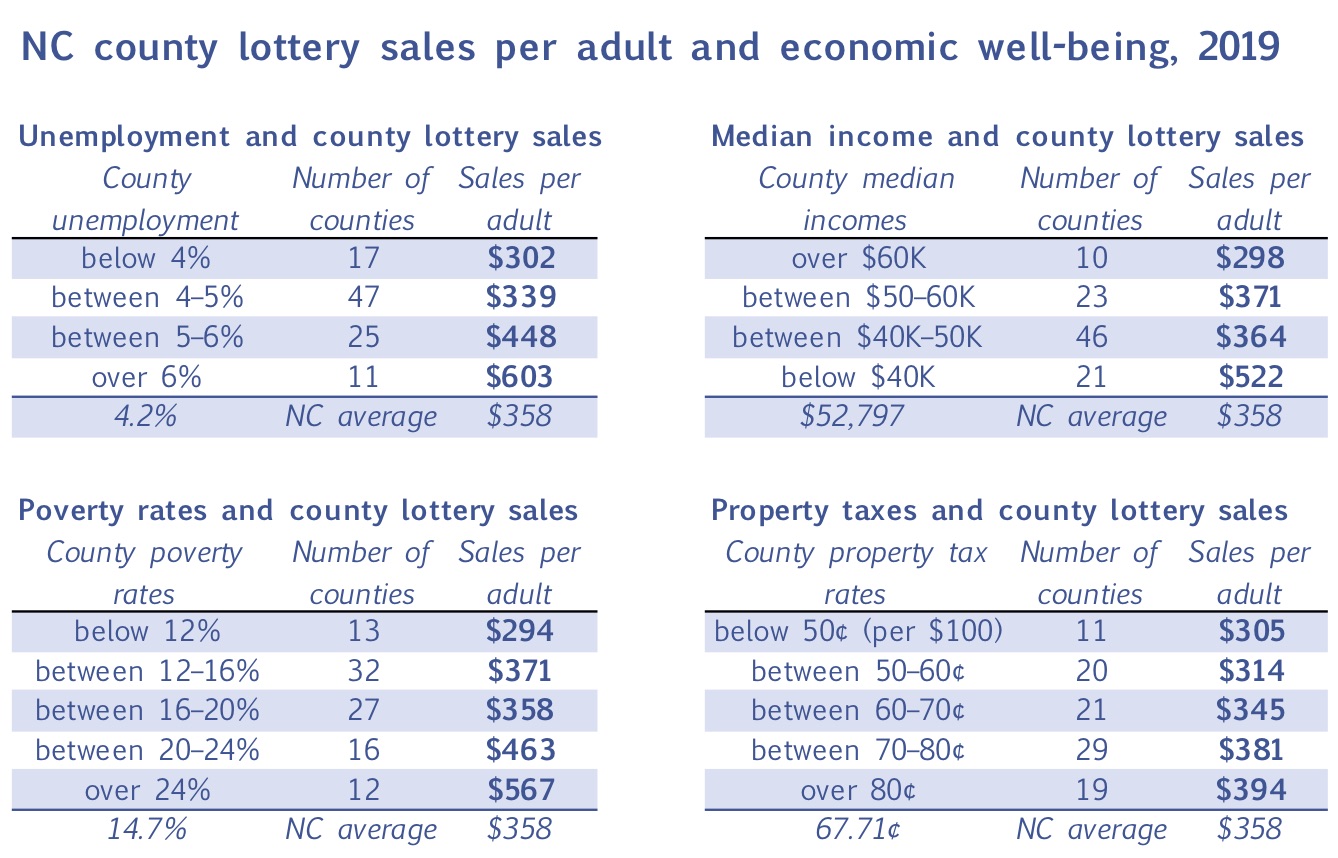
Sanders then breaks lottery ticket sales down even further by county, into each category: unemployment, income level, poverty rate, and property taxes (see image).
Read the full brief here. Read more about this issue and others like it in our 2018 North Carolina Policy Solutions Handbook.