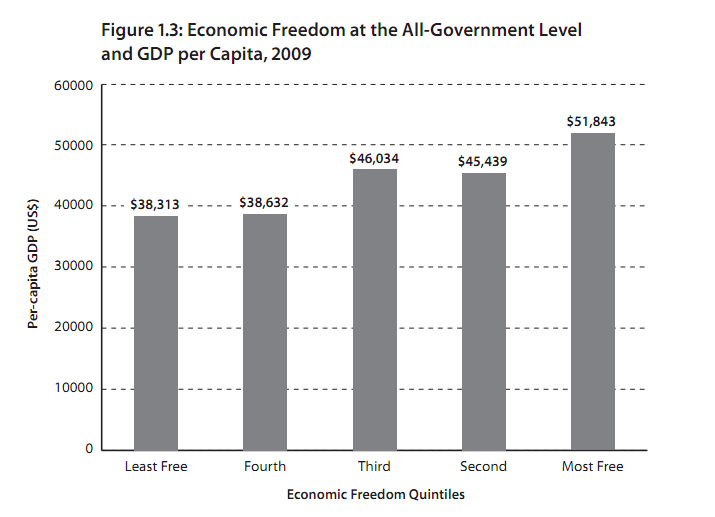
Of all American states and Canadian provinces, North Carolina is the 10th freest economically—9th within the United States. That’s according to the Fraser Institute‘s 2011 Economic Freedom of North America 90-page report, which assesses each political unit according to size of government expenditure, tax burden, and labor market freedom (p.38).
Released on November 22, the ranking draws on data from 2009, and North Carolina was tied for 4th according to 2007 and 2005 data, so the state has slipped from scores of 7.6 and 7.5 to the current 7.2 out of 10. On the other hand, North Carolina remains comfortably ahead of neighbors Tennessee (20th), Virginia (21st), and South Carolina (41st). Only Georgia came out slightly ahead at 6th with a score of 7.2.
Alberta, Canada—home of the oil sands and potential pipeline—was the winner of this year’s ranking, surpassing past winners Delaware (2nd) and Texas (3rd). The next best Canadian province was Saskatchewan, also on the prairies, at 32nd.
Canadian provinces struggle primarily on account of their rigid labor markets, without right-to-work legislation. From the report (p.vii):
In 2009, the average unionization rate for Canada was 32.7% while the average for the United States was 12.77%; the average minimum wage burden in Canada was 41.39% of GDP per capita while the US average was 33.80%; and the average government employment rate for Canada was 23.91% but 18.25% for the United States.
Still, Alberta’s ascendance signals a broader trend of Canadian provinces advancing past American states, even if five of Canada’s 10 provinces still occupy the bottom of the rankings. Quebec (58th), Nova Scotia (59th), and Prince Edward Island (60th), in particular, are way behind their peers.
Nathan Ashby of the University of Texas at El Paso, coauthor of the report, notes that a significant part of the relative improvement of the Canadian provinces can be attributed to policies in the United States.
The average score for Size of Government in the United States declined from 7.1 to 6.4 at the all-government level… These changes resulted from an average increase in government consumption of 5.02 percentage points between 2000 and 2009 and an increase of 1.93 percentage points in transfers and subsidies.
These changes have consequences. The top 10 states have an average per-capita GDP of $49,818, compared to $43,812 of the lowest 40.
As the size of government increases, there is less room for free economic activity—people buying and selling what they want, rather than paying taxes to take whatever government gives… states and provinces with low levels of economic freedom will see families experience lower standards of living and reduced opportunities.


