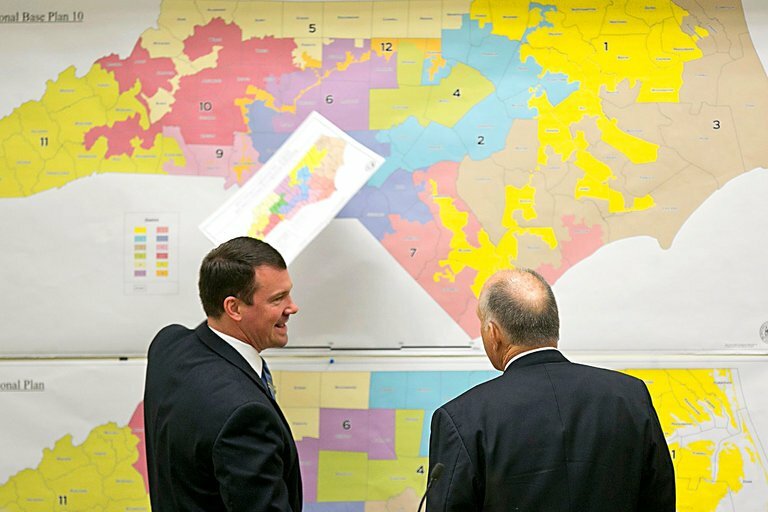
Friday, February 18 was the deadline for the new state legislative and congressional maps to be sent to the trial court by the Legislature and the Plaintiffs in the Harper v. Hall Case. Those tracking the redistricting process took to reviewing the legislatures’ proposed maps throughout last week, with the House maps receiving bipartisan support from both chambers.
Democrats gained a greater advantage under the new maps, with the General Assembly meeting the courts partisan lean criteria for the Senate and congressional Maps. Those maps drew the ire of Legislative Democrats and their allies for not being as favorable to the Democratic Party as were the House maps.
The court should accept these maps due to the General Assembly meeting the criteria laid before them in the February 4th redistricting order, meeting the median-mean, efficiency gap, and the partisan litmus test of these maps. The Civitas Center for Public Integrity has already discussed the submitted maps’ median-mean data and found that the General Assembly maps comply with the court order.
Let’s look at all the maps sent to the court by the plaintiffs and the General Assembly to compare them to the expert witness’ testimony and see if they meet the partisanship, median-mean, and efficiency gap criteria. While the court did not define the parameters for efficiency gap, expert witness Dr. Simon Jackman, in the Common Cause v. Lewis, indicated anything within -7% to 7% is in the acceptable range.
All data were collected by utilizing the shapefiles plaintiffs and defendants sent to the court and the composite election data in the free redistricting app Dave’s Redistricting (DRA). An excel file and a link to the DRA pages can be found below for their respective maps.
The variance between the two parties defined district rankings. A variance of more than 10% was considered a safe district, 5%-9.99% was considered a lean district, and less than 5% was considered a competitive district. Positive numbers mean a district favors Republicans, while negative numbers favor Democrats.
North Carolina Congressional Maps
- Combined Congressional Maps DRA spreadsheet
- Old enacted Congressional Maps DRA
- New Legislative Congressional Maps DRA
- League of Conservation Voters (LCV) Congressional Maps DRA
- Harper Congressional Maps DRA
During the trial on the original maps, plaintiffs’ experts found that North Carolina’s congressional maps under political neutral criteria would likely give Republicans an advantage of either a 9-5 or 8-6 congressional map.
Figure 1: Graph from Dr. Daniel Magleby indicating that a 9-5 or 8-6 are the most likely outcome of a map drawn using political neutral criteria. Graph source: Page 22 of Mableby’s written testimony in North Carolina League of Conservation Voters v. Hall.
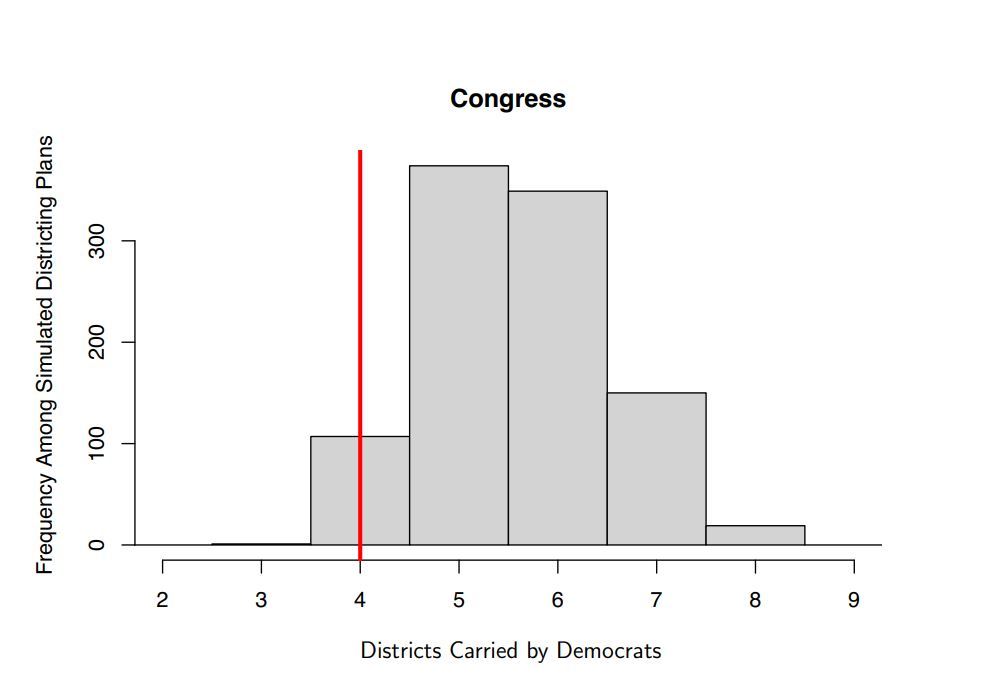
Table 1: Graph from Dave’s Redistricting regarding all enacted congressional maps by the North Carolina State Legislature and plaintiffs in Harper v. Hall that were submitted to the court for consideration.
| Congressional District Maps | Old Enacted Map | New Legislature Map | LCV Map | Harper Map |
| Republican Seats | 10 | 8 | 6 | 7 |
| Democrat Seats | 4 | 6 | 8 | 7 |
| Efficiency Gap | -17.32% | -6.37% | -0.67% | -1.50% |
| Median-Mean | -5.78% | -.66% | 1.66% | -0.05% |
The General Assembly’s new maps meet the partisan, efficiency gap, and median-mean criteria set by the court. The LCV congressional map is an outlier when looking at their median-mean criteria and likely partisan representation, giving far more seats than their expert Dr. Daniel B. Magleby findings would indicate.
The Harper plaintiff’s map comes closest to meeting the court’s median-mean criteria, but its partisan leanings do not meet the findings of their expert witnesses.
Senate Maps
- Combined Senate Maps DRA spreadsheet
- Old Enacted Senate Maps DRA
- New Legislative Senate Maps DRA
- League of Conservation Voters (LCV) Senate Maps DRA
- Harper Senate Maps DRA
Expert witnesses concluded that the most likely Senate maps would be a 28-22 map favoring Republicans.
Table 2: Graph from Dave’s Redistricting regarding all enacted Senate maps by the North Carolina State Legislature and plaintiffs in Harper v. Hall that were submitted to the court for consideration.
| Senate District Maps | Old Enacted Map | New Map | LCV Map | Harper Map |
| Republican Seats | 29 | 28 | 26 | 28 |
| Democrat Seats | 21 | 22 | 24 | 22 |
| Efficiency Gap | -7.14% | -4.24% | -1.67% | 1.21% |
| Median-Mean | -3.66% | -0.77% | 0.07% | -0.08% |
The newly redrawn maps by the General assembly meet all the court’s criteria, meeting the most likely outcomes for partisan makeup and fitting within the parameters of the median-mean outcomes and the efficiency gap. Both the Harper and LCV maps fall further outside the normative range on the median-mean scale, favoring democrats in their leanings. The LCV map also falls on the extreme side of the plaintiff’s expert witness criteria for partisan leanings, heavily favoring democrats in their proposed maps.
House Maps
- Combined House Maps DRA spreadsheet
- Old Enacted House Maps DRA
- New Legislative House Maps DRA
- League of Conservation Voters (LCV) House Maps DRA
- Harper House Maps DRA
The House is slightly different in the findings compared to the Senate and congressional maps. Magleby and other Plaintiff witnesses found that the most likely outcome is a 68-52 Republican map. The new General Assembly map instead creates a 63-57 Republican map.
Table 3: Graph from Dave’s Redistricting regarding all enacted House maps by the North Carolina State Legislature and plaintiffs in Harper v. Hall that were submitted to the court for consideration.
| House District Maps | Old Enacted Map | New Map | LCV Map |
| Republican Seats | 70 | 63 | 62 |
| Democrat Seats | 50 | 57 | 58 |
| Efficiency Gap | -6.71% | -2.72% | -1.58% |
| Median-Mean | -3.61% | -0.89% | -1.11% |
While receiving significant bipartisan support in both legislative chambers, the House maps fail to meet most of the criteria laid out by the court. It is not because it overly favors Republicans, it is the opposite. It much more heavily favors Democrats than the plaintiff’s expert witness would imply. Magleby’s findings never found a situation in his ensemble maps that democrats received 57 seats. This indicates that both the LCV and new legislature maps are outliers in partisan criteria. Both maps also fail in meeting the median-mean, being extreme outliers in favor of Democrats.
While on paper the LCV maps seem to be more favorable to Republicans based on median-mean efficiency analysis, when reviewing it under the partisan seat criteria, you see why this is not the case. In a good election year like 2022 is shaping up to be, it is possible for Republicans to take the 70 seats required for a supermajority under the legislative remedial map. That is not the case under the LCV’s map, which would require that the General Assembly win all competitive seats and a likely Democratic seat to win a supermajority.
According to the analysis run through Dave’s redistricting, both the new congressional and Senate maps passed by the General Assembly meet all the criteria that the supreme court and plaintiffs have asked for. Yet plaintiffs are still pushing for a further democrat advantage in many of their maps. The only maps that fall outside of the plaintiff’s criteria are the House maps, giving Democrats a far larger advantage than the plaintiffs’ data allows for. Should the trial court or the Supreme Court throw out the Senate and congressional maps and keep the House maps, this will not be about partisan fairness but instead about ensuring that maps favor the Democratic party as much as possible.