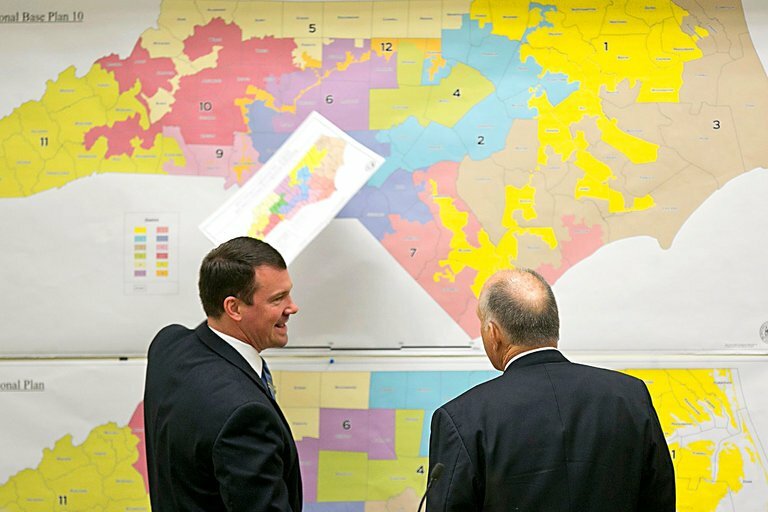
The North Carolina League of Conservation Voters is the lead plaintiff in one of the lawsuits over North Carolina’s recently enacted congressional and state legislative district maps. In their complaint, they offered alternative maps, that they imply (on page 63) “avoid partisan gerrymandering and racial vote dilution.”
However, their congressional map dilutes black voters to the point where not a single district in their map would fulfill Voting Rights Act requirements.
Map drawers are not required to draw majority-minority districts (in which, for example, a majority of the black voting-age population is black) in order to fulfill the Voting Rights Act. As noted in Pender County v. Bartlett (2007):
[A] black voting age population of at least 38.37 percent would afford blacks, consistent with [the Voting Rights Act] section 2’s command, the ability to elect their preferred candidate.
More recent scholarship has established a black voting-age population (BVAP) of 37 percent as an “empirical bright line” for districts in which black voters have a chance to elect candidates of their choice:
Nationally, 37% is an empirical bright line for congressional voting: 32 out of 34 current U.S. congressional districts with at least 37% BVAP had Representatives in the 115th Congress who belong to the Congressional Black Caucus, and the ratio drops off precipitously below that level.
(That 37 percent threshold applies only to Congressional districts; similar thresholds for state legislative districts have not been established.)
So, how does the NCLCV map compare to the General Assembly map on congressional districts with a BVAP of 37 percent or more? To find out, data from their court filing (appendix pages 279 to 305) was uploaded to DRA 2020, an online redistricting program. The DRA 2020 already had the General Assembly’s congressional map loaded.
The North Carolina League of Conservation Voters’ Congressional Map Has No Districts in Which Blacks Could “Elect Their Preferred Candidate”
Congressman G. K. Butterfield, in announcing his retirement from Congress, claimed the General Assembly’s new congressional map would “disadvantage African American communities all across the 1st [now 2nd] congressional district.” While the BVAP of his district in the General Assembly’s map is 39.99 percent, the BVAP of his district in the NCLCV’s map is only 34.75 percent.
The decrease in the 9th District, located in Charlotte, is even more extreme. The BVAP drops from 37.95 percent in the General Assembly map to 29.79 percent in the NCLCV map. Both the 2nd and the 9th are currently represented by black Democrats.
As seen in Table 1, the map passed by the General Assembly includes two districts with the minimal BVAP of 37 percent to allow black voters to elect candidates of their choice while the NCLCV map has none.
Table 1: Number of districts that satisfy minimum Black voting-age population levels in congressional maps
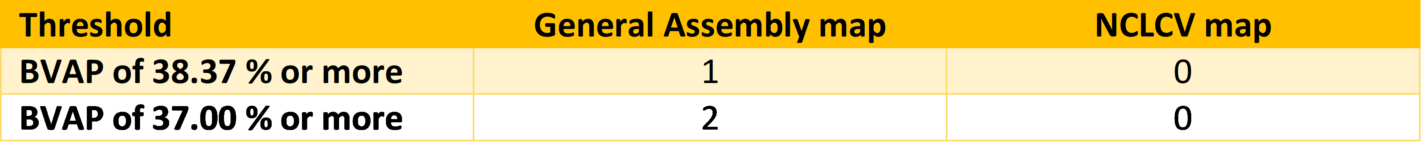
Data sources: North Carolina General Assembly and NCLCV v. Hall complaint
Earlier research discovered that the NCLCV congressional map provides an 8-6 advantage to Democrats, something their own expert witness found was statistically impossible. Now we have discovered that none of the districts in their map have enough BVAP for Black voters to elect their preferred candidates. Combined, these findings indicate that the NCLCV map is designed to maximize the number of white Democrats North Carolina sends to Congress.