A few weekends ago, I decided it was time to paint our living room. It made me start thinking about home ownership and how the recent recession has affected home purchases and home upgrades. What is going on in the housing market today?
Many people put off renovating their homes after 2008 due to the lowering of home values, which led to a lack of equity to finance such projects. 2013 is showing a turn-around in those home values, and redecorating projects are increasing. Fewer people are delaying home design projects due to the economy, and more are fixing up their homes with the intention of living in them longer than prior to the recession. Before the recession, homeowners tended to buy properties, put money into them, and sell them in two years for a profit, whereas now statistics are showing people living in their homes longer.
According to the US Census, 84 percent of people in North Carolina lived in the same house one year or more from 2007-2011. This table shows home remodeling done in the U.S. along with dollars spent for each project. In looking at this data, remember that the price of Lowes and Home Depot stocks have risen steadily since the end of 2011, which directly correlates with the increase in remodeling projects done by homeowners.
|
REMODELING PROJECT |
Projects with work done |
Households with work done by outside contractor |
Number of households by amount spent (dollars) |
|||
|
Number |
Percent of households |
Under $1,000 |
$1,000 to $2,999 |
Over $3,000 |
||
|
Unit indicator |
(1,000) |
(percent) |
Number |
(1,000) |
(1,000) |
(1,000) |
|
Convert garage/attic/basement into living space |
2,535 |
1.11 |
706 |
597 |
410 |
983 |
|
Remodel bathroom |
14,511 |
6.36 |
4,231 |
5,885 |
3,167 |
2,973 |
|
Remodel kitchen |
8,452 |
3.71 |
3,097 |
2,732 |
1,240 |
3,062 |
|
Remodel bedroom |
7,146 |
3.13 |
1,196 |
4,138 |
1,032 |
451 |
|
Convert room to home office |
3,105 |
1.36 |
256 |
1,927 |
277 |
66 |
|
Convert room to home theater |
723 |
0.32 |
125 |
268 |
201 |
103 |
|
Remodel other rooms |
5,862 |
2.57 |
1,042 |
2,887 |
893 |
1,079 |
|
Add bathroom |
1,062 |
0.47 |
205 |
330 |
132 |
247 |
|
Add/extend garage |
481 |
0.21 |
110 |
141 |
32 |
164 |
|
Add other rooms – exterior addition |
1,086 |
0.48 |
307 |
256 |
164 |
435 |
|
Add deck/porch/patio |
5,414 |
2.37 |
1,654 |
1,633 |
1,433 |
1,315 |
|
Roofing |
8,224 |
3.61 |
5,154 |
1,654 |
1,478 |
3,842 |
|
Siding – vinyl/metal |
2,193 |
0.96 |
1,046 |
373 |
293 |
907 |
|
Aluminum windows |
1,589 |
0.70 |
759 |
350 |
346 |
433 |
|
Clad-wood/Wood windows |
875 |
0.38 |
468 |
274 |
115 |
399 |
|
Vinyl windows |
4,719 |
2.07 |
2,555 |
1,212 |
950 |
1,625 |
|
Ceramic tile floors |
6,659 |
2.92 |
2,377 |
3,276 |
1,664 |
514 |
|
Hardwood floors |
4,962 |
2.18 |
1,928 |
1,392 |
1,455 |
1,068 |
|
Laminate flooring |
4,700 |
2.06 |
1,162 |
2,428 |
874 |
485 |
|
Vinyl flooring |
2,785 |
1.22 |
864 |
1,809 |
239 |
114 |
|
Carpeting |
7,189 |
3.15 |
4,126 |
2,399 |
2,147 |
1,057 |
|
Kitchen cabinets |
4,400 |
1.93 |
1,782 |
1,081 |
792 |
1,420 |
|
Kitchen counter tops |
4,911 |
2.15 |
2,553 |
1,327 |
983 |
1,456 |
|
Skylights |
787 |
0.35 |
383 |
289 |
49 |
79 |
|
Exterior doors |
5,672 |
2.49 |
2,186 |
3,092 |
1,009 |
273 |
|
Interior doors |
4,544 |
1.99 |
1,388 |
2,419 |
676 |
234 |
|
Garage doors |
2,649 |
1.16 |
1,500 |
1,188 |
796 |
54 |
|
Concrete or masonry work |
3,883 |
1.70 |
1,922 |
1,788 |
734 |
665 |
|
Swimming pool – in ground |
560 |
0.25 |
277 |
137 |
36 |
294 |
|
Wall paneling |
1,327 |
0.58 |
187 |
672 |
59 |
24 |
|
Ceramic wall tile |
2,439 |
1.07 |
901 |
1,458 |
317 |
84 |
Budgeting
When homeowners budget for home renovations or improvements they tend to look at the areas of their homes that will bring the largest return when they sell. Houzz, a collaborative online platform for home remodeling and design, did a study of over 100,000 respondents on decorating and renovation activity in the United States. While this is not a scientific study, it does give some insight into this niche area of the housing market.
The previous data showed that the majority of projects completed cost under $1,000. The Houzz study did a break down of budgeting during projects and the homeowners’ ability to stay within their set budgets.
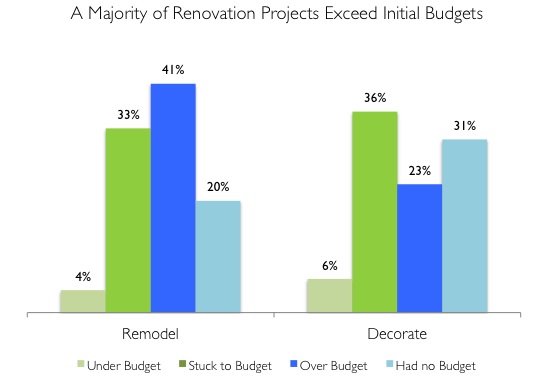
So what exactly are people fixing in their houses? According to the data in the table provided by the U.S. Census, the majority of households are remodeling their bathrooms and kitchens, yet majorities of people overspend their budgets when doing remodeling projects. This does not bode well for people wanting to increase the value of their homes for resale, since the majority of projects will cost more than the value they will add to the home. According to Remodeling Magazine, in the Raleigh area a midrange bathroom addition will only recoup 55% of the cost where a midrange bathroom remodel will recoup 65% of the cost. In Charlotte a midrange minor kitchen remodel will recoup 75% of the cost where a midrange major kitchen remodel will recoup 71% of the cost. You can find the whole report for cost versus value for both Raleigh and Charlotte areas here.


Everyone has a different motivation for remodeling or renovating his home. According the Houzz study, over 50 percent of homeowners admit to improving the home for increased home value whereas 83 percent do it to improve the overall feel and layout of the home for more comfortable living. The big thing to remember is the cost versus the recoup value when the house is sold. Looking at the average spent on a kitchen and bathroom remodel, we can estimate that between 25 and 30 percent of the cost of the project will be lost when the home is sold.
Click here for the Fiscal Updates archive.