Dr. Mandy Cohen, North Carolina Department of Health and Human Services (DHHS) secretary, gave a presentation before the NC House Health Committee on June 17. This was the week before Gov. Roy Cooper ordered North Carolinians to wear face masks while oddly refusing to lift any business restrictions. North Carolinians were simultaneously told (a) masks of any kind and porousness are effective at virus prevention, but (b) many businesses above half capacity are too dangerous for people, masks or not, while other businesses are too dangerous, period.
Cohen’s presentation included a slide on “Slowing the Spread of the Virus” that included this: “Research on Effectiveness of Face Coverings.” Basically, this research amounts to the administration’s case for requiring face masks statewide. Here is Cohen’s summary of their findings:
- As many as 230,000 to 450,000 COVID-19 cases may have been averted by May 22 due to face-covering mandates in 15 states and DC.
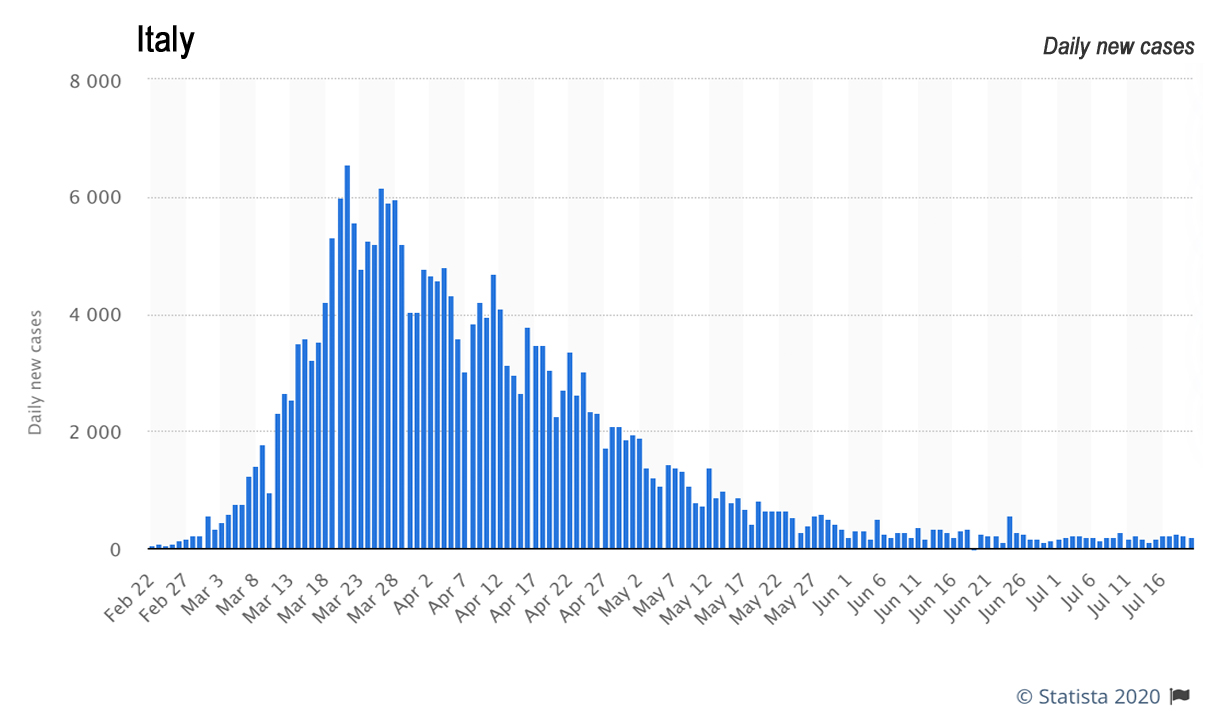
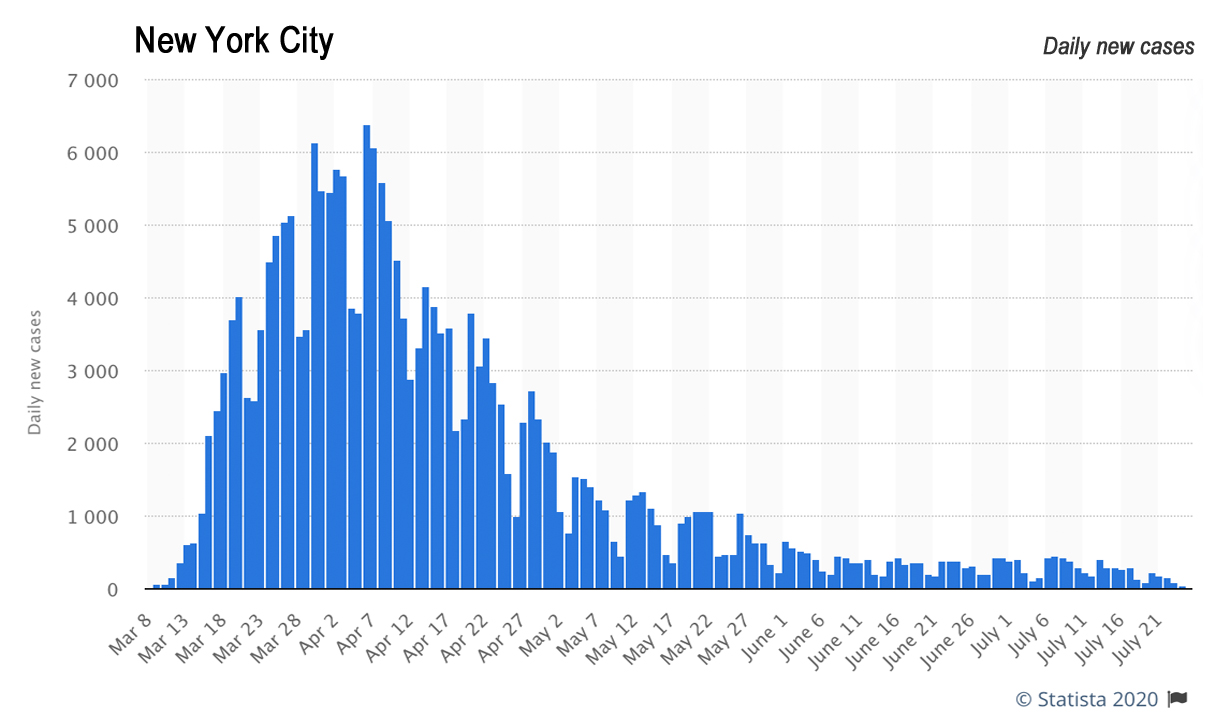
- Face covering reduced the number of infections by over 78,000 in Italy (from April 6 to May 9) and by over 66,000 in NYC (from April 17 to May 9).
- In Germany, the daily growth rate of COVID-19 cases fell by ~40% due to mandatory mask-wearing.
Sources:
Lyu and Wehby. Community Use Of Face Masks And COVID-19: Evidence From A Natural Experiment Of State Mandates In The US. Health Affairs. June 16, 2020.
Zhang et al. Identifying airborne transmission as the dominant route for the spread of COVID-19. Proceedings of the National Academy of Science. June 11, 2020.
Mitze et al. Face Masks Considerably Reduce COVID-19 Cases in Germany: A Synthetic Control Method Approach. Institute of Labor Economics. June 2020.
It’s been six weeks since Cooper ordered people across the entire state of North Carolina to wear face masks based on this research. Did Cohen and Cooper think about how applicable this research would be to North Carolina? Or did they merely select studies with sensational numbers to make another order seem justified?
Consider:
- One study purports to look at the effectiveness of mandated mask-wearing in two notorious virus epicenters, Italy and New York City.
- One study purports to look at it in municipal regions in Germany.
- One study purports to look at it in 15 US states and DC.
The applicability of these studies to NC would be just an academic exercise were it not for the inescapable fact that Cooper is wielding unprecedented government power over North Carolinians in his executive orders, and these studies appear to be the basis for having expanded them into mandating face coverings. Furthermore, from the plain text of the state Emergency Management Act, it would seem that Cooper is using an illegal exercise of power.
It’s not as if Cooper and Cohen are using these studies to persuade and recommend North Carolinians to adopt a practice voluntarily that they believe is healthy. Furthermore, there does not appear to be any objective standard in place for lifting this order or the underlying executive orders. They’re open-ended.
In the rest of this report, I will discuss these studies, look into their likely applicability to North Carolina, review their findings, and consider them in the context of COVID-19 cases in North Carolina.
Mask mandates in Italy and New York City (Zhang et al.)
Why this study might be applicable to NC
Italy and New York City (NYC) were notorious virus epicenters that were compelled to take drastic steps to mitigate the rate of infections earlier than NC.
Why this study might not be applicable to NC
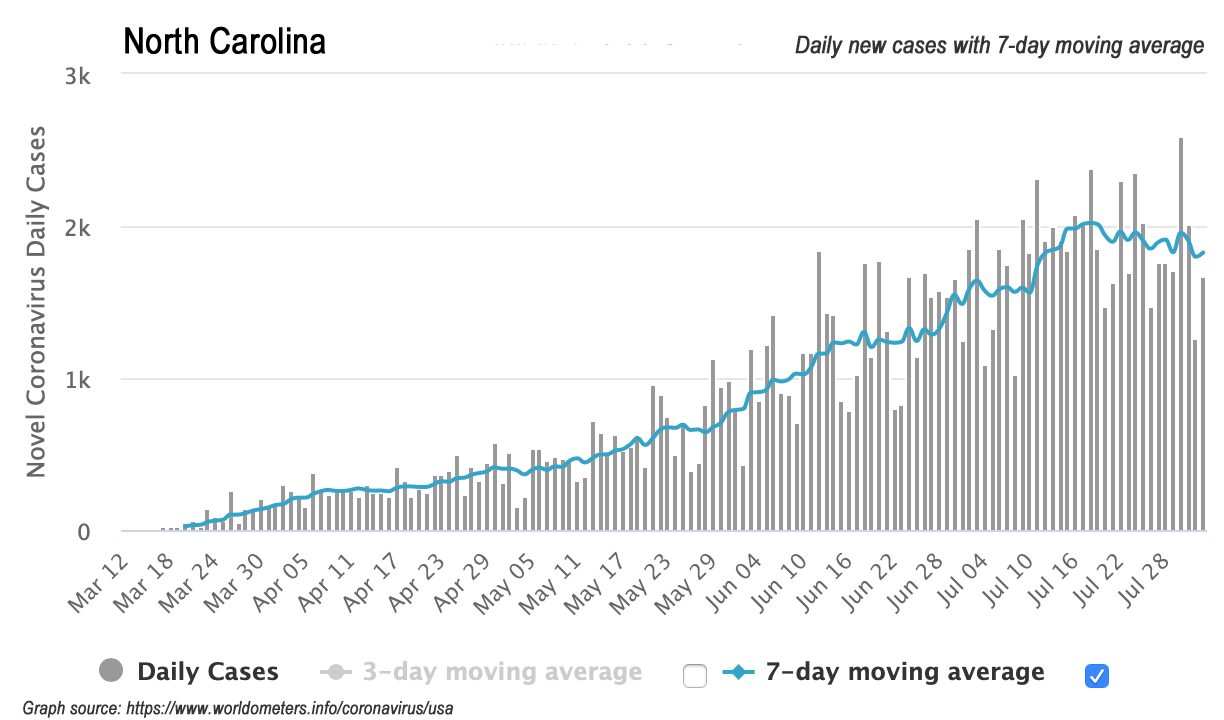
North Carolina never approached the level of outbreak experienced by Italy and NYC. Those places experienced the feared epidemic “spike” curve, the one that NC and other jurisdictions sought to avoid by adopting policies to “flatten the curve,” i.e., spread out infections so as not to overwhelm hospitals. NC’s curve was flattened, with hospitalizations higher now but still not anywhere near the projected, flattened-curve peak.
Bear in mind that the epidemic spike not only features a sharp increase in infections before reaching peak infections, but it also features a sharp dropoff in infections afterward. If a policy intervention was made after the peak of infections and during the steep dropoff, it could be credited wrongly for this natural decrease.
Here are Italy and New York City’s curves of daily new cases of infections:
Here is NC’s curve:
What the study found
Zhang et al. compared mitigation measures of the virus and its trend in three epicenters: Wuhan, China; Italy; and NYC. They argued that Wuhan experienced a quicker decline in trends of cases and deaths than was seen in Italy and NYC. They attributed that decline to the fact that Wuhan, unlike the West, mandated the wearing of face masks at the same time it instituted other mitigation measures shared by the West (testing, quarantine, social distancing measures, lockdowns, etc.). With respect to testing, however, the study does not appear to account for any changes in testing over time (which would impact case detection).
They concluded that mandated face masks were “the determinant in shaping the pandemic trends worldwide,” arguing that “wearing of face masks in public corresponds to the most effective means to prevent interhuman transmission.”
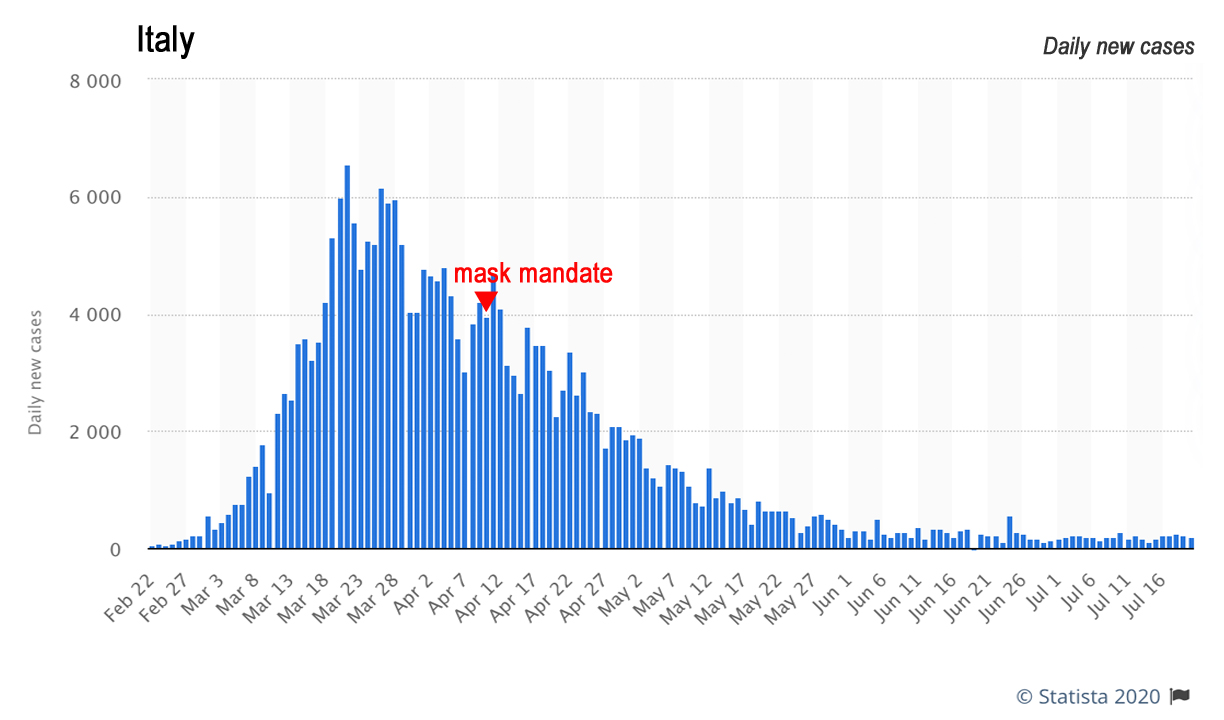
The numbers Cohen cited in her presentation to the General Assembly were taken from this part of the study. Italy didn’t mandate face masks until April 6 (northern Italy, then the rest of Italy on May 4), and NYC didn’t mandate face masks until April 17. Zhang et al. projected a linear (“no mask”) assumption in case increases in Italy and NYC, and then compared their projection with actual cases. The differences between actual cases and their linear (“no mask”) assumption are where they derived their finding quoted by Cohen: “Our analysis indicates that face coverings reduced the number of infections by over 78,000 in Italy from April 6 to May 9 and by over 66,000 in NYC from April 17 to May 9.”
On Italy and NYC’s curves, when did their mask mandates occur?

Review
Italy and NYC’s epidemic spike curves are completely different from NC’s flattened curve. Also, Italy and NYC’s impositions of their mask mandates well after their peak of daily new cases makes it difficult to ascertain how much actual effect their mask mandates had on cases. Expecting a linear progression of cases post-peak also seems inflationary to the number of cases (under a no-mask assumption) over time.
Conclusion
The applicability of this study to North Carolina is highly questionable.
Mask mandates in municipal regions in Germany (Mitze et al.)
Why this study might be applicable to NC
This provisional study looks at regional variation in known COVID-19 cases in Germany at the adoption of mandatory face masks. These areas do not appear to be epicenters of the virus. The study notes that “mask regulations in German regions do not require a certain type,” similar to Cooper’s order.
Why this study might not be applicable to NC
The study’s focus municipal region, Jena, was the first region in Germany to mandate face masks. North Carolina was one of the later states in the US to mandate masks. Also, NC is a large and diverse state, not a single municipal region. Furthermore, as the authors acknowledge, “Germany is only one country. Different norms or climatic conditions might change the picture for other countries.”
What the study found
Mitze et al. focused on Jena, the first municipal region in Germany to order mask-wearing (on April 6), as other national policy interventions, such as lockdowns, were already in place. They compared Jena’s actual known COVID-19 cases under the mask mandate with those of a “synthetic” control version of Jena as predicted by computer modeling. This synthetic Jena comprised a weighted average of similar regions with similar regional characteristics but no mask mandates.
Their next focus was on other municipal regions that mandated face masks after Jena but by April 22. They compared results in those regions against those in regions that mandated masks on April 27 or later.
Appendix C details their reasons for abandoning testing four other early-mandate municipal regions as they tested Jena. They found positive results from mask mandates in Rottweil and Wolfsburg, but “very small or unclear” results for Nordhausen.” As for the fourth, “the region of Main-Kinzig, it even seems to be the case that masks increased the number of cases relative to the synthetic control group.”
Mitze et al. found very large effects in reducing the growth rate of COVID-19 infections for Jena from being the first to mandate face masks. They found very small effects for the other regions, however. They suggested those very small effects might owe to “behavioral adjustments,” i.e., voluntary mask-wearing taking place in other regions before their own mandates (which then would hide the effects of mask-wearing as measured by when it was mandated). They, therefore, viewed finding even a small effect in the other regions as indicative that mask mandates have very large effects in reducing the growth rate of COVID-19 infections. They also do not appear to account for any changes in testing over time.
In their abstract, Mitze et al. wrote that “Depending upon the region we analyze, we find that face masks reduced the cumulative number of Covid-19 cases between 2.3% and 13% over a period of 10 days after they became compulsory.”
The numbers Cohen cited in her presentation to the General Assembly were taken from their findings for Jena. “We believe that the reduction in the growth rate of infections by 40% to 60% is our best estimate of the effects of face masks,” they wrote in their conclusion, stating, “The most convincing argument stresses that Jena introduced face masks before any other region did so.
Going further, however, Mitze et al. ventured to “stress that 40 to 60% might still be a lower bound” and even hazarded that the effects of masks on reducing the growth rate of COVID-19 infections “might have been even greater if masks had been introduced earlier.”
Review
A 40% reduction in the rate of growth in new known cases is a very robust finding, to say the least. The authors admit conjecture in suggesting that a reduction in cases by 40 to 60% might be a “lower bound” had masks been mandated earlier.
With respect to NC, however, that’s the point. The state was not an early mover in mandating face masks. There would, therefore, be no reason to expect NC under a mask mandate to behave like the region of Jena and see a 40% reduction in cases. Perhaps it could be that NC under a mask mandate could see a reduction of 2.3 to 13% of cases, relative to where the state’s numbers would be without it.
But it also could be that NC under a mask mandate could behave more like the region of Nordhausen and see “very small or unclear” results — or like Main-Kinzig and see case numbers increase more with the mandate that without it.
Conclusion
The applicability of this study to North Carolina is highly questionable.
Mask mandates in 15 US states and DC (Lyu and Wehby)
Why this study might be applicable to NC
NC is one of the 50 states in the US, and it is standard and reasonable to compare policy differences and outcomes among the states. Lyu and Wehby specifically looked at states that had executive orders or directives signed by governors between April 8 and May 15 to mandate face masks.
Why this study might not be applicable to NC
The study might not be applicable to NC if there are early-mover benefits to mandating face masks, if there were reasons unique to them that caused those 15 states and DC to mandate face masks earlier than others, if there are reasons unique to NC that might cause it to have different outcomes, or if there are other outside factors at play.
What the study found
Lyu and Wehby identified 15 states and DC with executive orders or directives issued between April 8 and May 15 that mandate mask-wearing. They used the preceding five days before announcing the mask mandates as the baseline period for the trends in those states in order to build a predictive model for cases numbers if those states did not mandate mask-wearing. They then compared the differences in actual case numbers with the predicted, no-mask case numbers.
They compared those differences over time, in five-day increments, to see if the effect of mandating masks increased over time. They estimated “daily case rate declines by 0.9, 1.1, 1.4, 1.7, and 2.0 percentage-points within 1-5, 6-10, 11-15, and 16-20, and 21+ days after signing [the mask orders], respectively.” They also do not appear to account for any changes in testing over time.
The numbers Cohen cited in her presentation to the General Assembly were taken from their estimated differences between actual case numbers in states mandating masks and their model’s estimates for cases had they not mandated masks. “The main model estimates suggest that as many as 230,000–450,000 cases may have been averted due to these mandates by May 22,” Lyu and Wehby wrote, then added, “Estimates of averted cases should be viewed cautiously and only as general approximations.”
They found that the effects of the mask orders were larger when measured from the dates they are announced and signed, rather than the dates they took effect (typically 2-3 days later), which they said suggested “earlier compliance.”
Elsewhere Lyu and Wehby estimated that the effects of mandated face masks “represent nearly 16–19% of the effects of other social distancing measures (school closures, bans on large gatherings, shelter-in-place orders, and closures of restaurants, bars, and entertainment venues) after similar periods from their enactment [sic]” (executive orders are by definition not enacted).
In Appendix A, they offered a few comparisons between states with and without mask-wearing orders. States with mask mandates had a slightly higher proportion of population 65 years of age or higher (16.5% vs. 15.8% in no-mandate states) and a slightly lower poverty rate (12.2% vs. 13.5%).
Where mask and no-mask states differed greatly was in cases per-capita and population density. States with mask mandates had five times as many cases per 100,000 people than no-mandate states: 277.7 cases vs. 55.4 cases. Counties in states with mask mandates were also over four times as population-dense as counties in no-mandate states.
Lyu and Wehby concluded that their study provided evidence states with mask mandates experienced a “greater decline in daily COVID-19 growth rates after issuing these mandates” than states without them. With a “second COVID-19 wave in the fall/winter” possible, they suggested “requiring the use of face masks in public might help in reducing COVID-19 spread.”
Review
The range of averted cases highlighted by Cohen that was estimated by Lyu and Wehby is quite wide, and they twice warned that their estimates “should be viewed cautiously,” explaining that they “are sensitive to assumptions and different approaches for transforming the changes in the daily growth rate estimates to cases.”
It seems important that early mask-mandate states were much more population-dense and had five times as many cases per capita as no-mandate states. It suggests that the mask mandates could have some basis in public health pressures not faced by those other states with lower population densities and a fraction of the cases per capita.
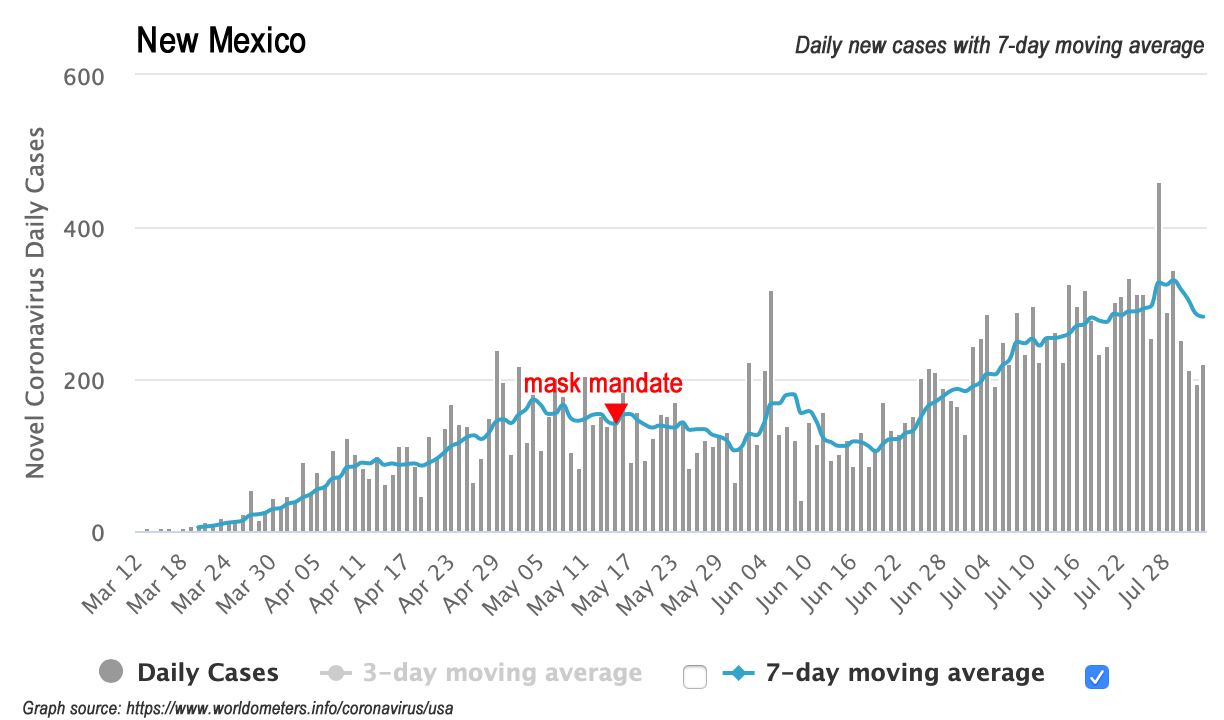
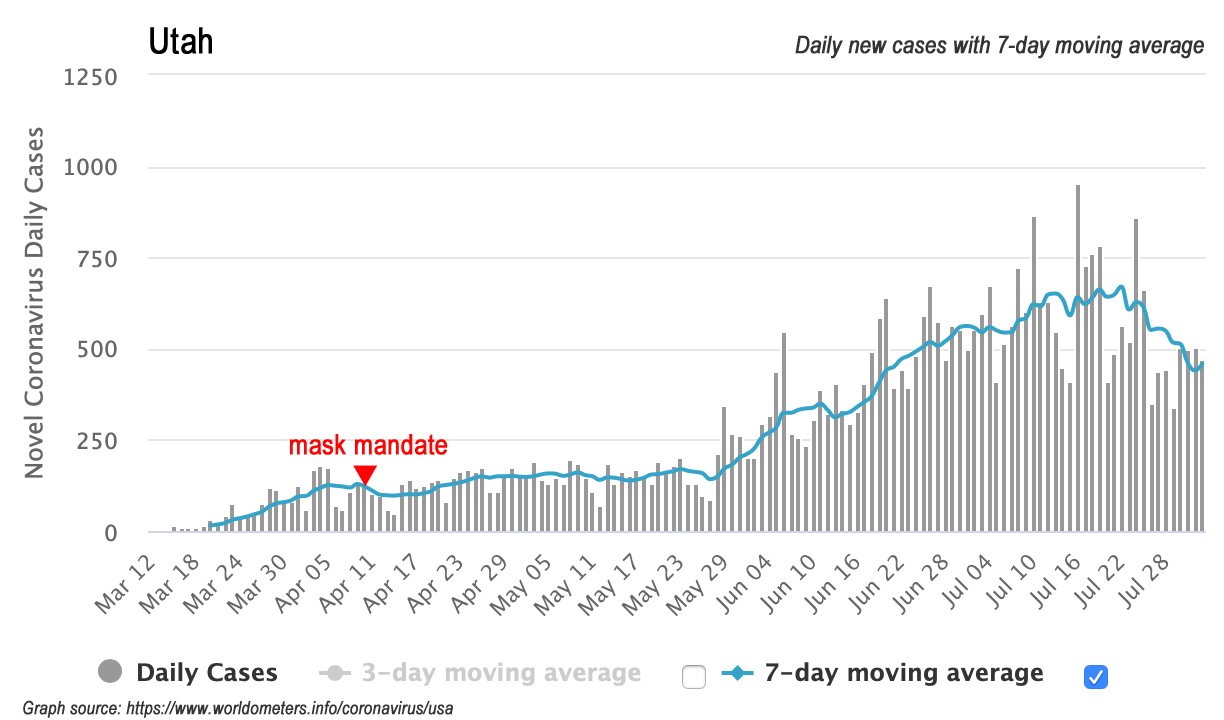
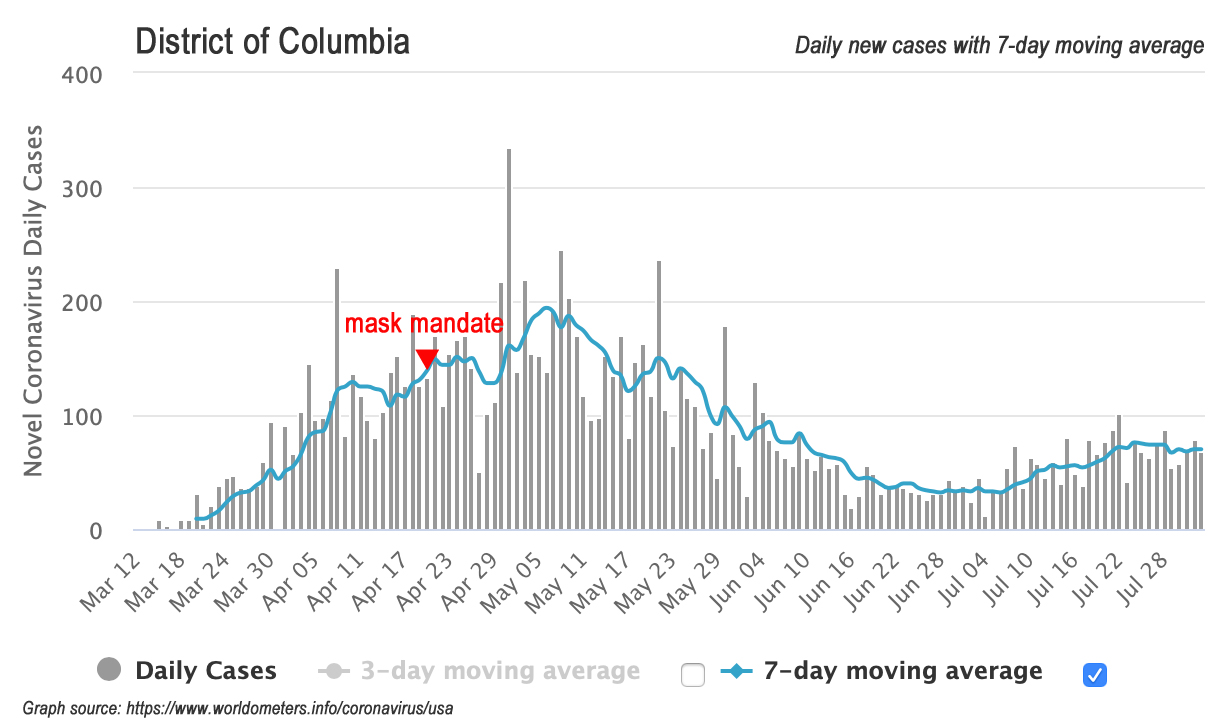
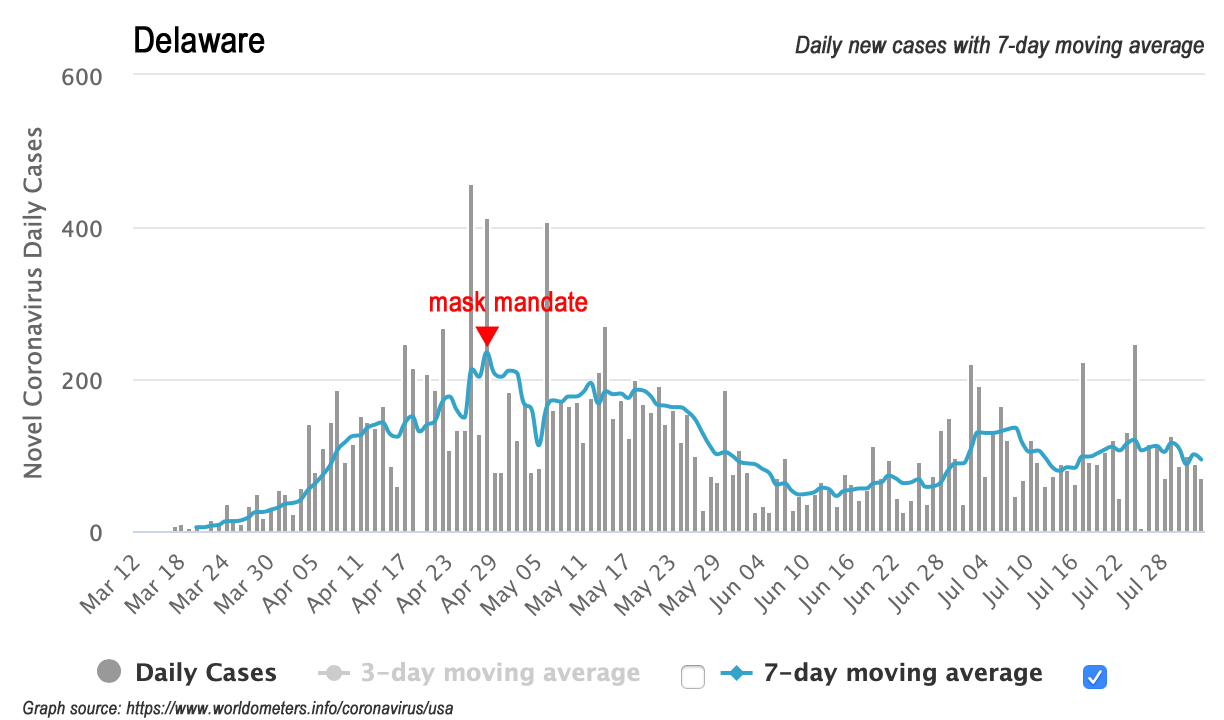
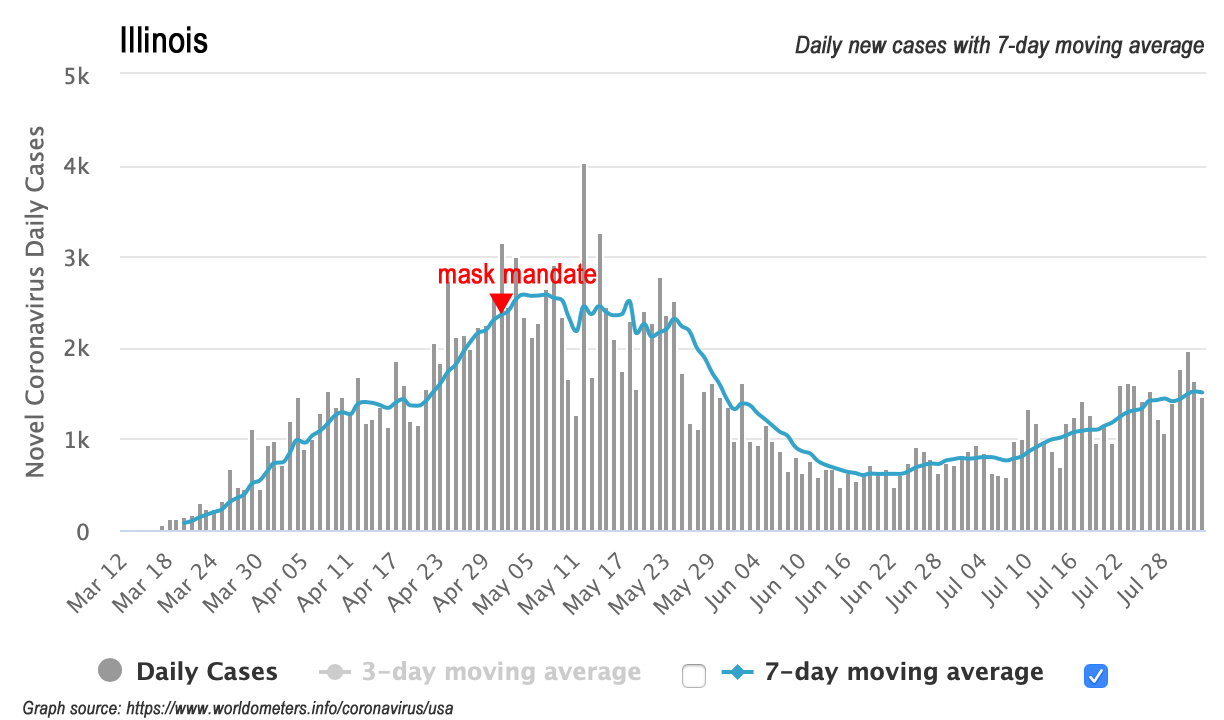
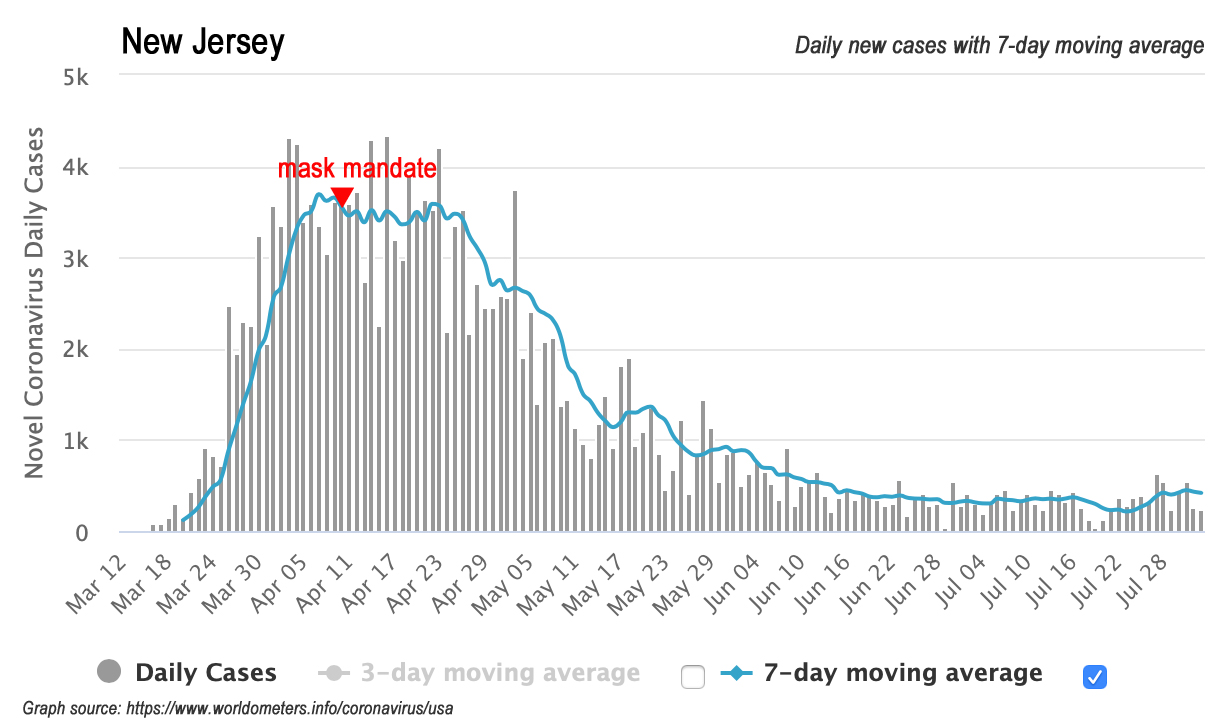
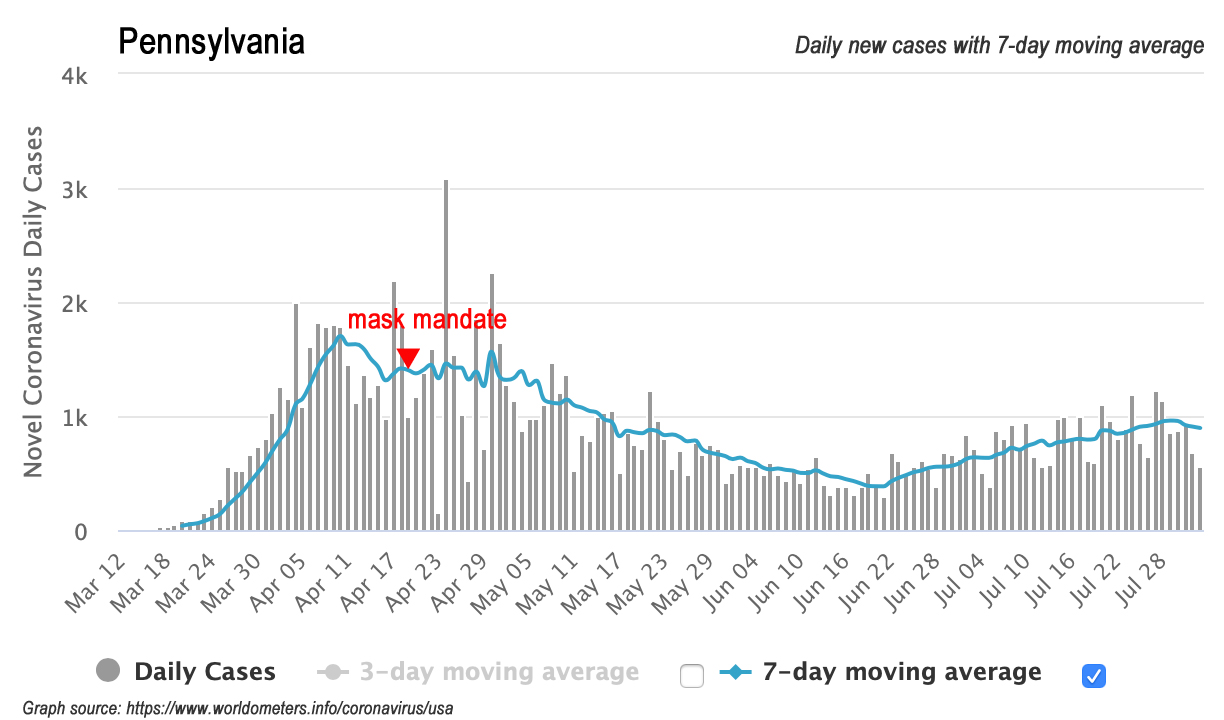
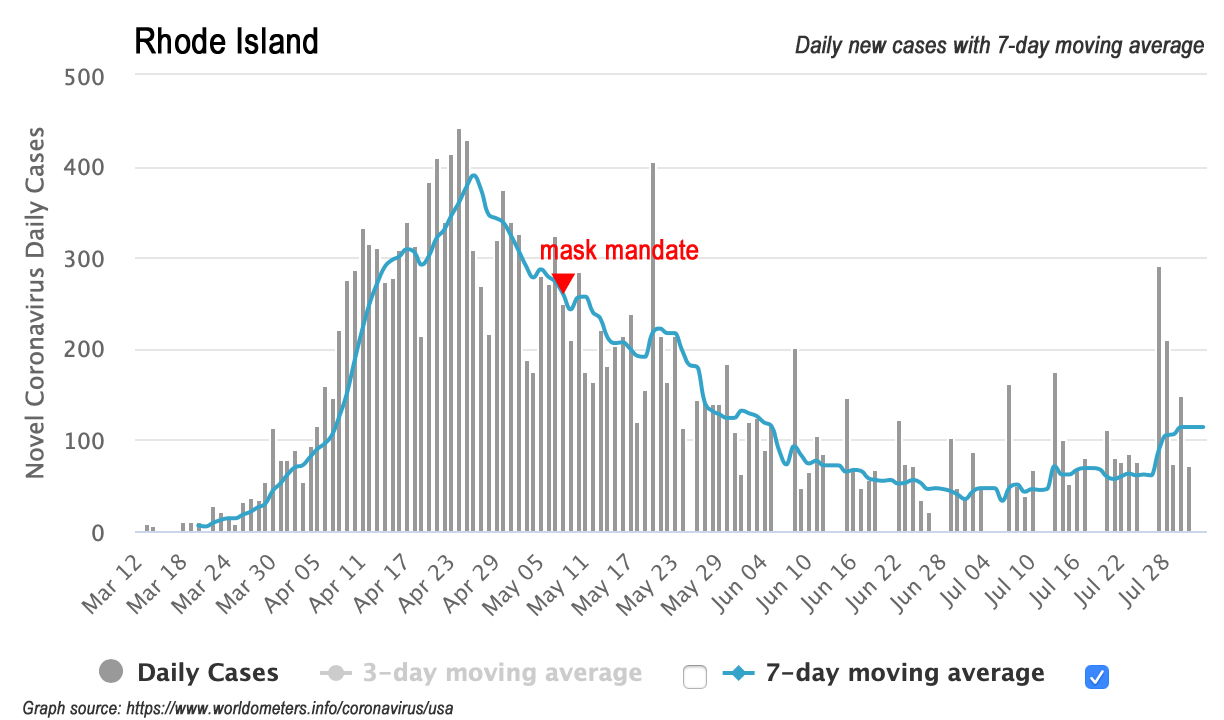
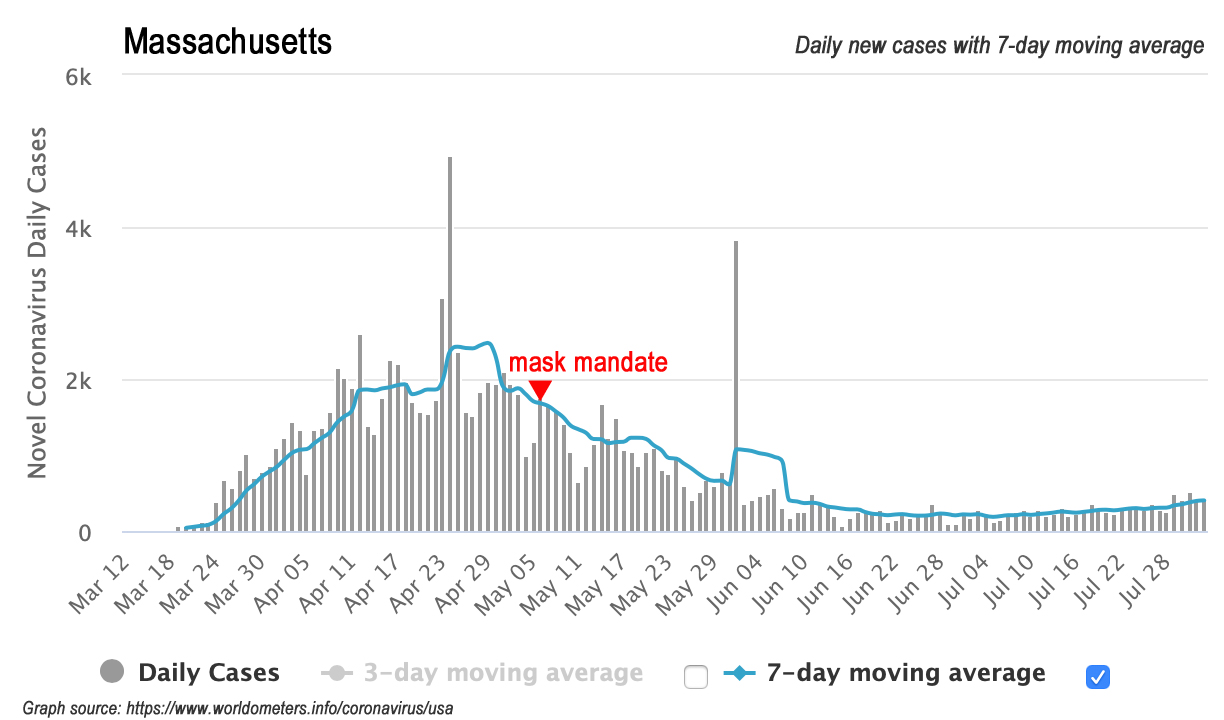
Here are 16 charts showing the daily new cases over time in these 15 states and DC, including when each state imposed a mask-wearing mandate. Someone seeking a pattern in these charts would be hard-pressed to find one.
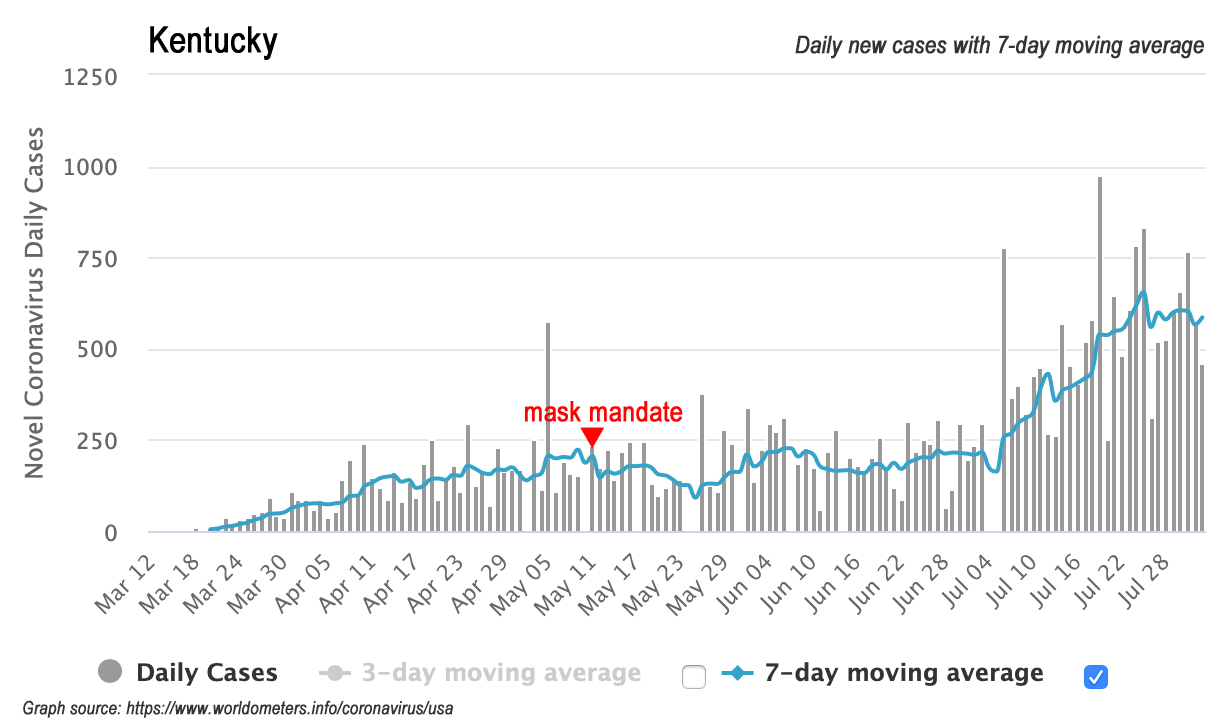

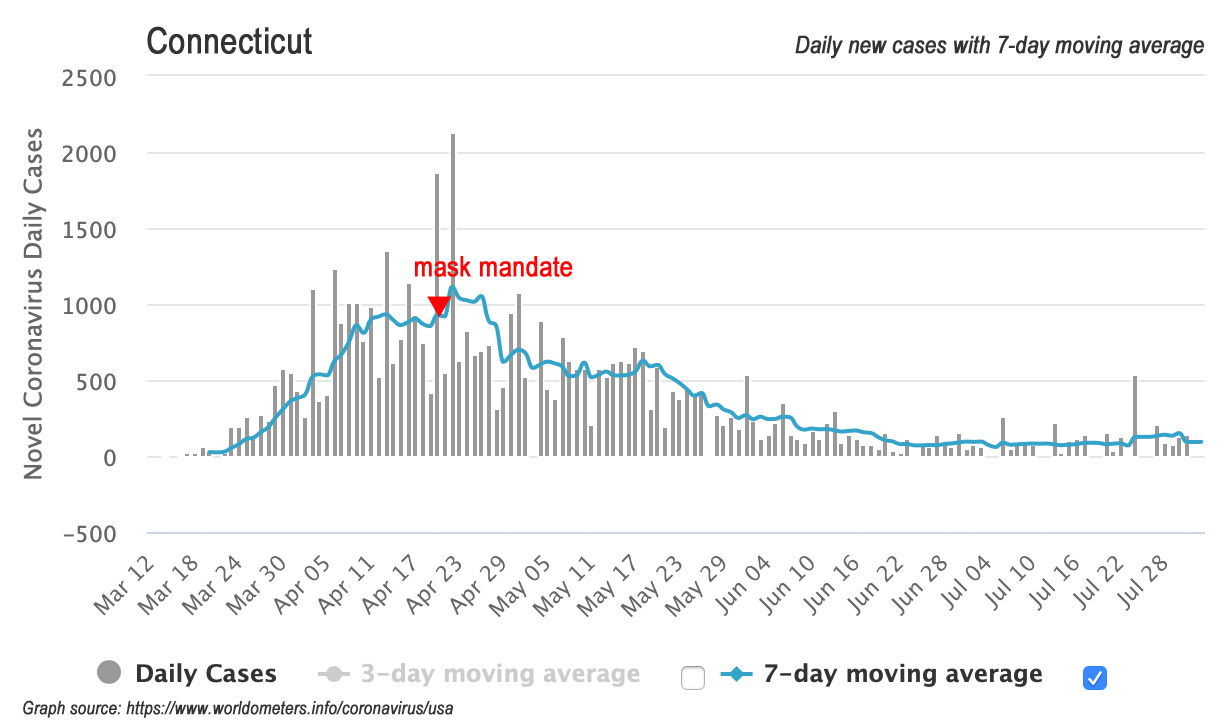

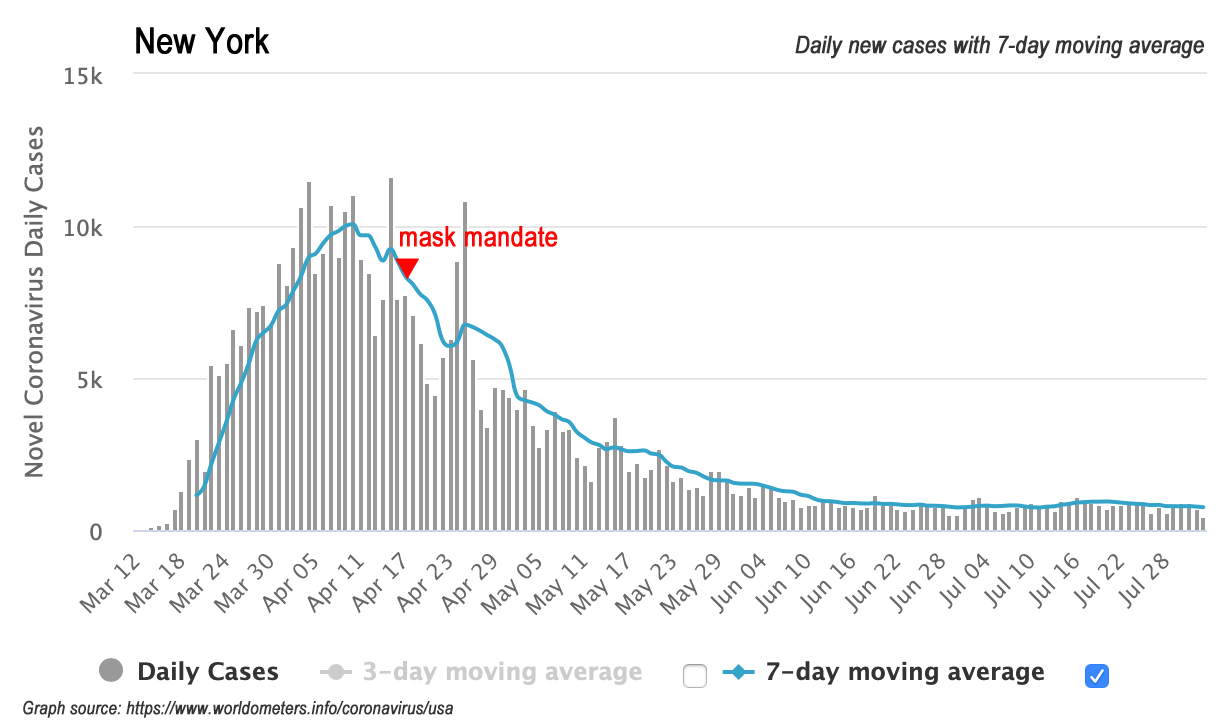

By way of comparison, here is North Carolina’s with the mask mandate marked:
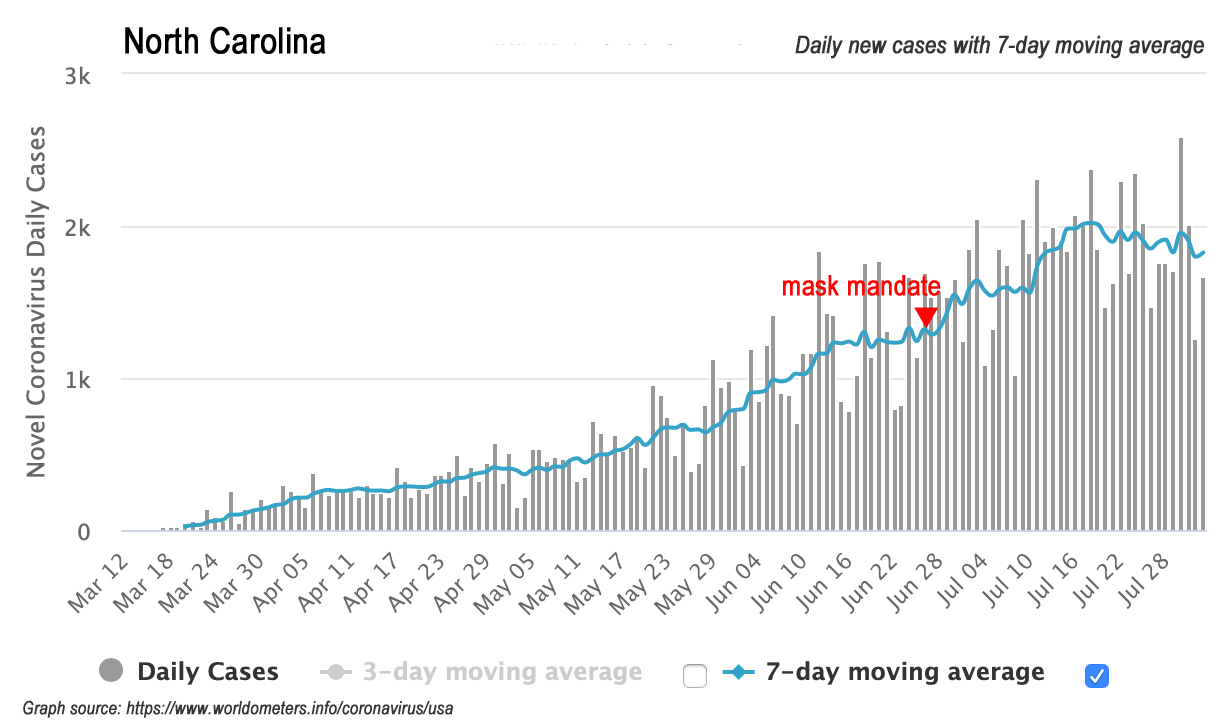
From those charts, you can see four states (Kentucky, Maine, New Mexico, and Utah) had mask orders in place well before they reached their peaks in daily new cases. Those states all have much lower population densities than North Carolina. Of those, Kentucky is the only one geographically close to NC.
DC and Maryland ordered masks shortly before reaching peak new cases. While both are geographically close to NC, the metropolis of DC is extraordinarily dense (53.5 times more population-dense than NC), and therefore unlikely to be a good model for NC. Maryland, however, is much closer to NC in population density (2.9 times more dense than NC) and a better prospective model for NC. Notice, however, that Maryland is currently undergoing a second wave of new cases despite having mandated masks.
Four states (Connecticut, Delaware, Illinois, and New Jersey) ordered masks at the apex of their daily new cases, which would seem to justify the orders. Of those three, only New Jersey seems unlikely to be a good model for NC, given that NJ experienced a sharp, epidemic spike in new cases and is 5.6 times more population-dense than NC. Connecticut (3.4 times denser) and Delaware (2.3 times) are closer. The closest to NC in terms of population density is Illinois, which is also currently undergoing a second wave of new cases despite having mandated masks.
The remaining six states mandated mask-wearing after their daily new cases had peaked. Four of those (Michigan, New York, Pennsylvania, and Rhode Island) had the sharper, epidemic spike curves, in which it would be hard to tell if the mandate was actually having a significant effect. Moreover, Michigan, Pennsylvania, and Rhode Island appear to be undergoing second waves of new cases despite having mandated masks.
Of the remaining two, Hawaii shares a similar population density to NC, but that’s about it. The state is also undergoing a second wave of new cases (fair to speculate if it is tourist-driven) despite the mask mandate. Being 4.1 times more population-dense than NC, Massachusetts could perhaps be a good prospective model; nevertheless, the fact that Massachusetts’ mask order followed their peak in new cases — which NC’s mandate certainly couldn’t do — offers a reason to doubt.
Conclusion
The applicability of this study to NC, while initially intriguing, seems lacking on closer consideration.
Recap
As stated above, the question of whether these emergent studies would actually apply to North Carolina is no longer academic. They may have favorable-sounding abstracts, but that can never be sufficient reason for open-ended rule by fiat.
Gov. Cooper has bet an enormous and unprecedented exercise of power against North Carolinians based on their findings. Such resort to power ought to be carefully considered and used only as a final, last resort, in the truest sense of emergency. (It should go without saying that this standard applies to the governor’s other orders restricting businesses and individuals.)
What should be done instead? Cooper and his health secretary, Cohen, are well situated to use their respective offices to recommend, to persuade, even to urge people to adopt practices such as wearing face coverings that they believe is healthy and proper. Doing so would reciprocate the respect and trust afforded them by their fellow North Carolinians, their co-equals in the eyes of God and our state constitution.