A three-judge panel approved remedial North Carolina House and Senate maps on February 23. The General Assembly drew those maps after the original maps they passed last November were tossed out by the North Carolina Supreme Court.
To help people understand how those districts will likely affect the political landscape, we are releasing the 2022 Civitas Partisan Index (CPI) for the new North Carolina House and North Carolina Senate districts.
How We Measure the Political Leanings of North Carolina Legislative Districts
We model the CPI after the Cook Political Report’s Partisan Voting Index. It is a measure of the base partisan leanings of a North Carolina state legislative district compared to the state as a whole. For each district, the CPI score lists the party (identified by initials, D or R) the district tends to favor, followed by a number indicating the relative lean of the district toward that party. For example, a district that tends to vote about 7 percent more Democratic than the state average would have a CPI score of D+7.
The 2022 CPI took precinct-level results of the ten 2020 Council of State races using data from the North Carolina State Board of Elections (NCSBE) precinct sort files. The Republican votes of ten races were added together in each state legislative district and divided by the total two-party votes for those ten races to get a Republican percentage in each district. That percentage is then subtracted from the Republican statewide average for those ten races (50.76%) to find the CPI rating for each district.
The 2020 Council of State races used in the CPI were for governor, lieutenant governor, commissioner of agriculture, commissioner of insurance, commissioner of labor, attorney general, secretary of state, superintendent of public instruction, state treasurer, and state auditor.
There are two ways the CPI may differ from other indexes. First, other indexes may base their scores on a composite of different races (president or United States senator for example). Second, other indexes might not base their rating on a comparison to the average statewide vote but instead compare the two-party vote totals when rating a district. Those differences in methodology can produce what appear to be very different results. So, for example, the CPI scores the 1st North Carolina Senate District R+10 (60.98% – 50.76% = 10.22%) while someone using the Dave’s Redistricting app would score it R+22 (60.07% – 37.98% = 22.09%). Both ratings are legitimate and indicate a safe Republican district.
The Partisan Leanings of the New North Carolina House and Senate Districts
We also assigned a rating to each district based on its CPI score. We rate districts with a CPI of 0–1 in either direction as a toss-up, 2–5 lean, 6–9 likely, and 10 or more safe seats for the respective parties. Districts with a 0 rating have a partisan lean of less than half a percentage point.
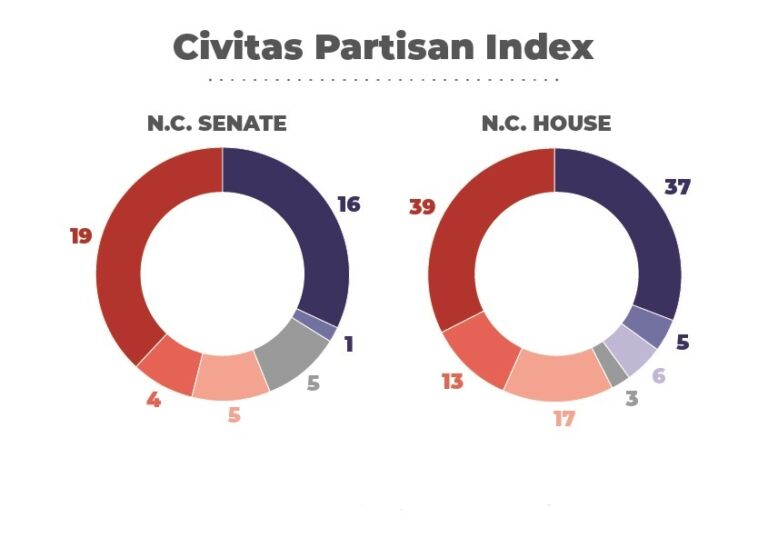
There are 50 seats in the North Carolina Senate and 120 in the North Carolina House. The CPI indicates that there are 14 safe Democratic, 3 likely Democratic, 5 lean Democratic, 4 toss-up, 2 lean Republican, 5 likely Republican, and 17 safe Republican seats in the Senate.
So, Republicans would start with 22 likely or safe seats in the Senate in a typical election. To secure a majority, they would have to pick up both Republican-leaning seats and two toss-up seats. They could gain a 30-seat super-majority (the three-fifths need to override gubernatorial vetoes) by picking up all the toss-us seats plus two Democratic-leaning seats. The Democrats need to gain all their lean seats plus all four toss-up seats to win a majority. Winning a super-majority would be difficult for them, requiring that they carry both Republican-leaning seats and two likely-Republican seats.
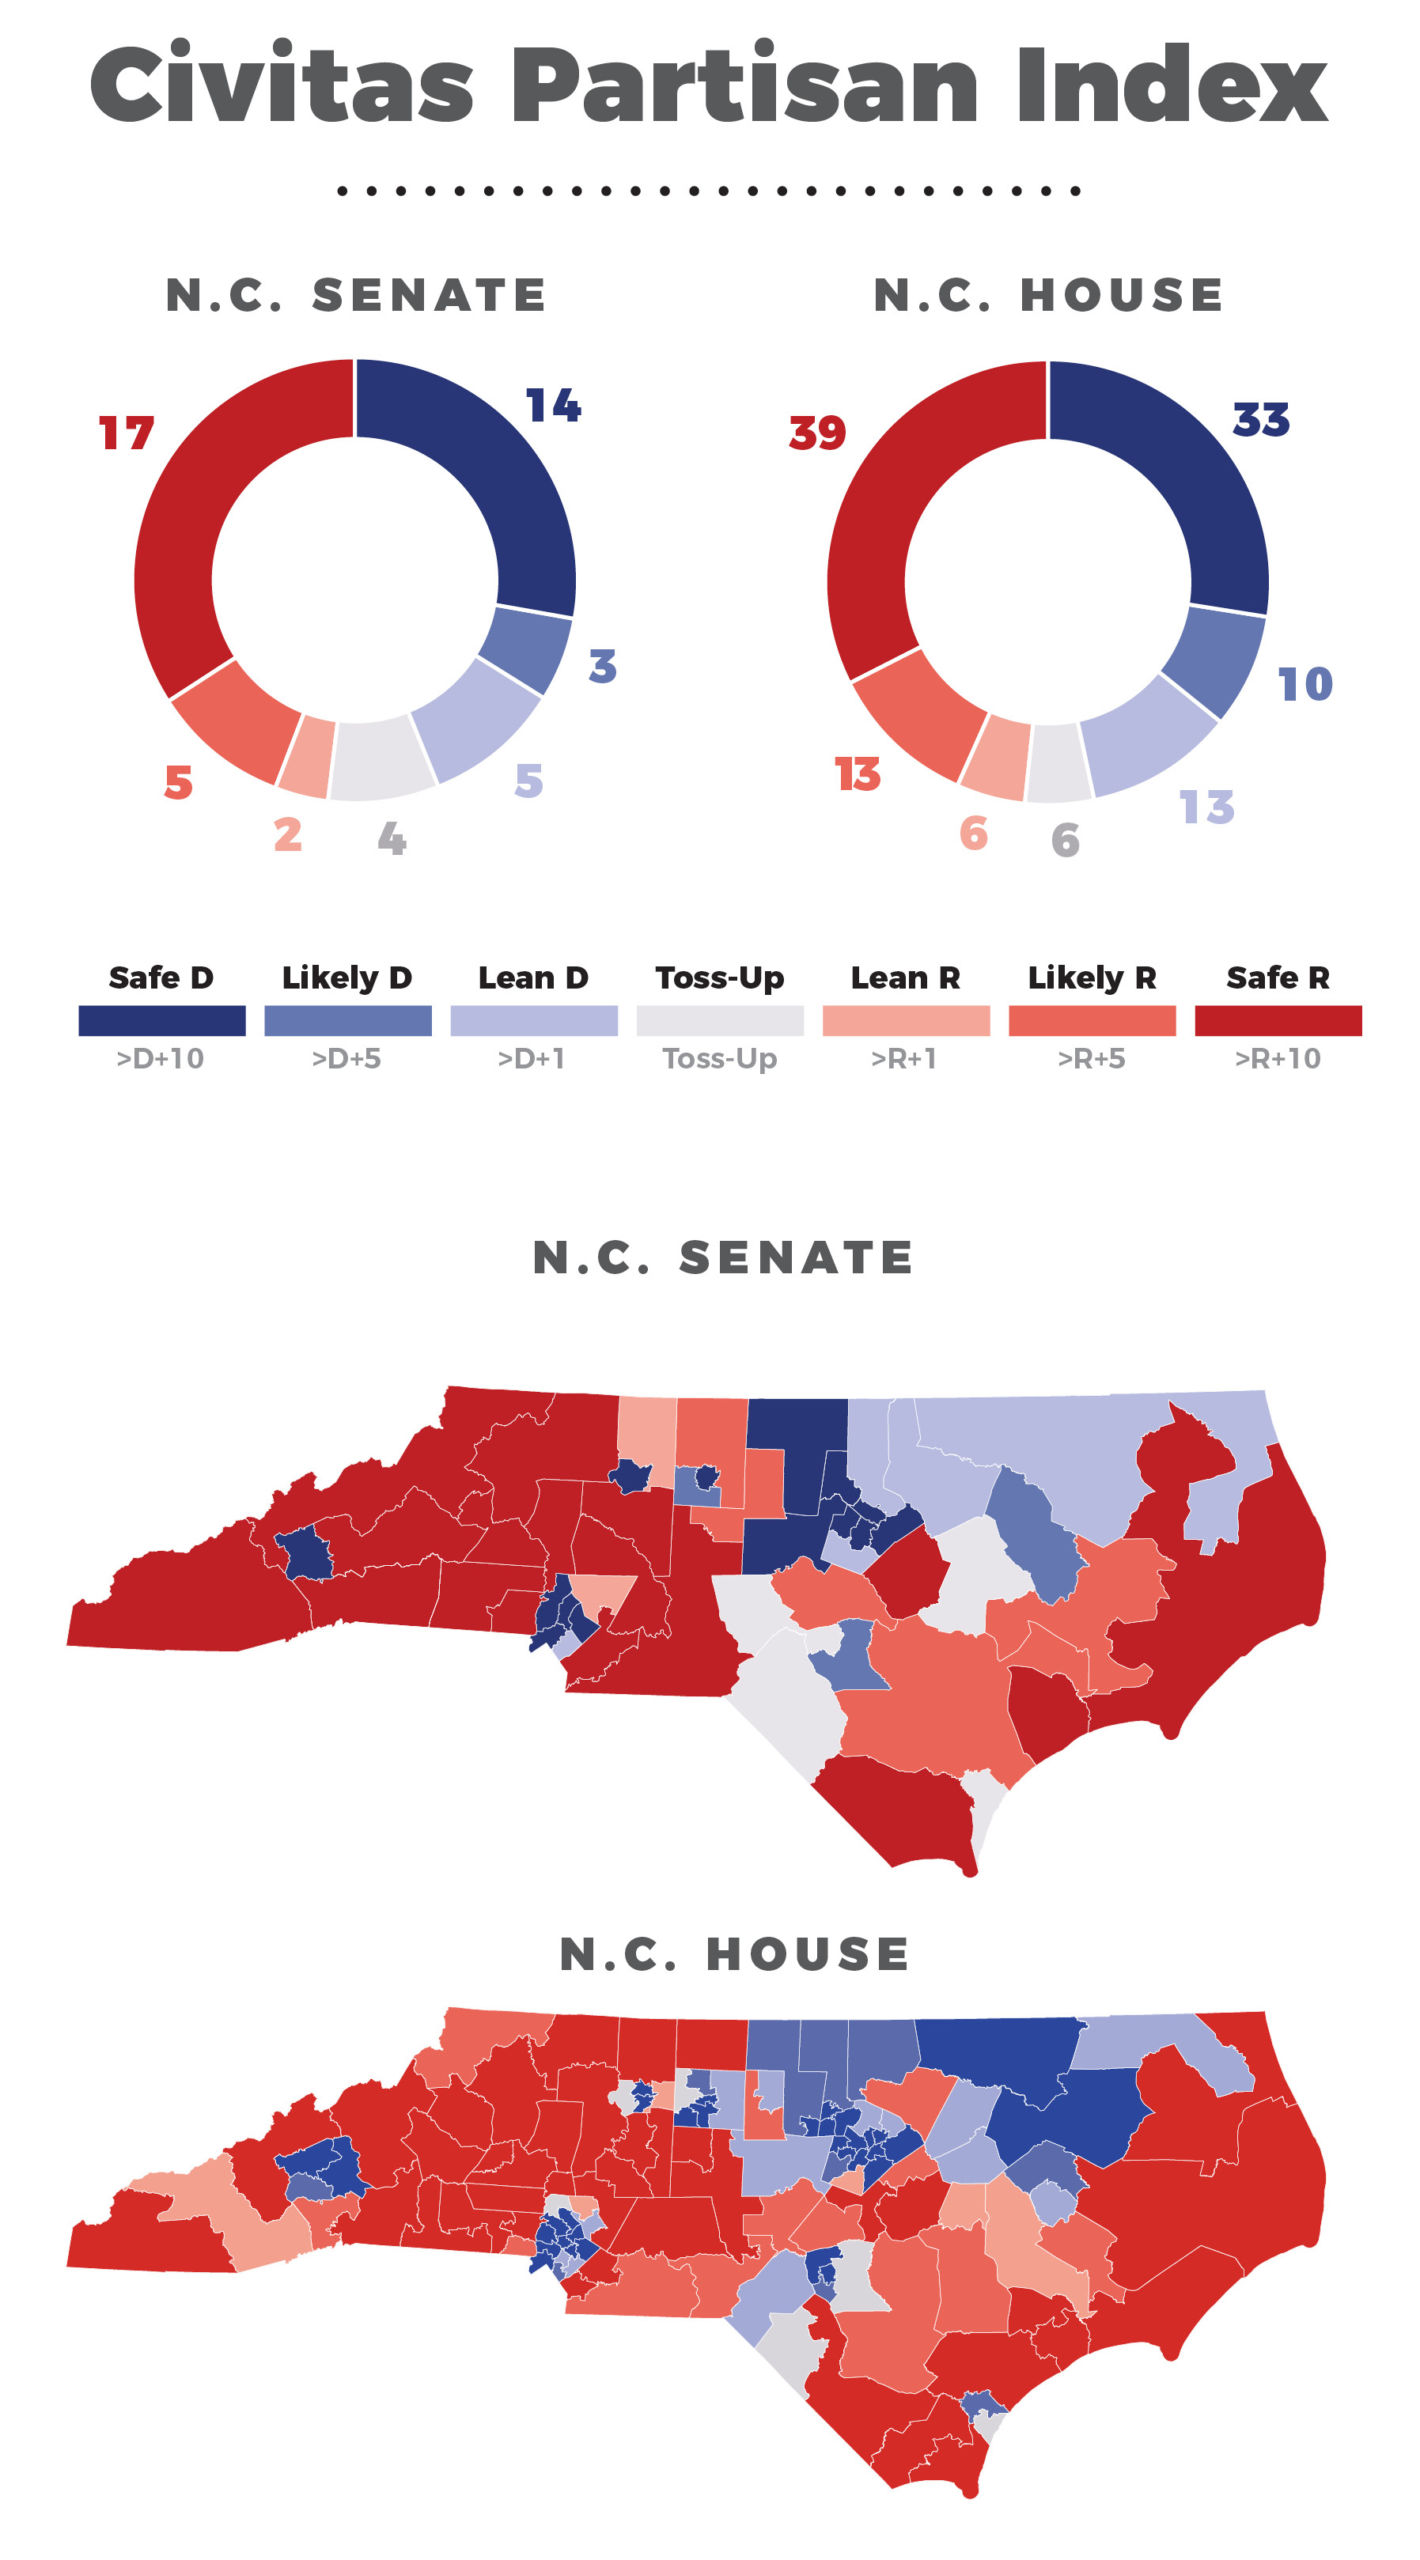
(Click on the graphic for a larger view.)
In the House, there are 33 safe Democratic, 10 likely Democratic, 13 lean Democratic, 6 toss-up, 6 lean Republican, 13 likely Republican, and 39 safe Republican seats.
Republicans could gain a majority simply by holding on to all the seats that tend their way plus three toss-up seats. Democrats also have a path to a majority if they win all the seats that tend their way plus five of the six toss-up seats.
The big difference is that more Democratic than Republican seats are vulnerable to a wave election. If Republicans pick up all the lean-Democratic districts, they will have a 77-43 super-majority. If Democrats carry all the lean-Republican districts, they will have a 68-52 majority, four seats shy of the 72 they would need for a super-majority.
Here are the spreadsheets for each chamber:
How to Use the CPI
The CPI is not a tool for predicting races since it does not include measures such as incumbency or measures of candidate quality such as funds raised. However, someone using the CPI without any other data would have successfully predicted 90 percent of state legislative races in 2018 and over 94 percent of races in 2020.
The CPI measures the general tendency of voters in a district to vote for one party or the other. Doing so creates a baseline measure that journalists, researchers, and others can use when examining North Carolina legislative races. Using the CPI can gain you essential insights into the 2022 election.