You probably have an inkling that long-term unemployment is bad news. Writing in the latest National Review, Kevin Hassett of the American Enterprise Institute offers data that back up your notion of the harmful impacts linked to lingering joblessness.
When there are many unemployed workers, openings disappear relatively quickly, and when there are many openings, unemployment tends to be low. Economists later began referring to this curve as the “Beveridge curve” after William Beveridge, an economist who studied unemployment in the first half of the 20th century.
Subsequent research has demonstrated that economies tend to move up and down a relatively stable Beveridge curve over the business cycle. In recessions, there tends to be high unemployment and few openings.
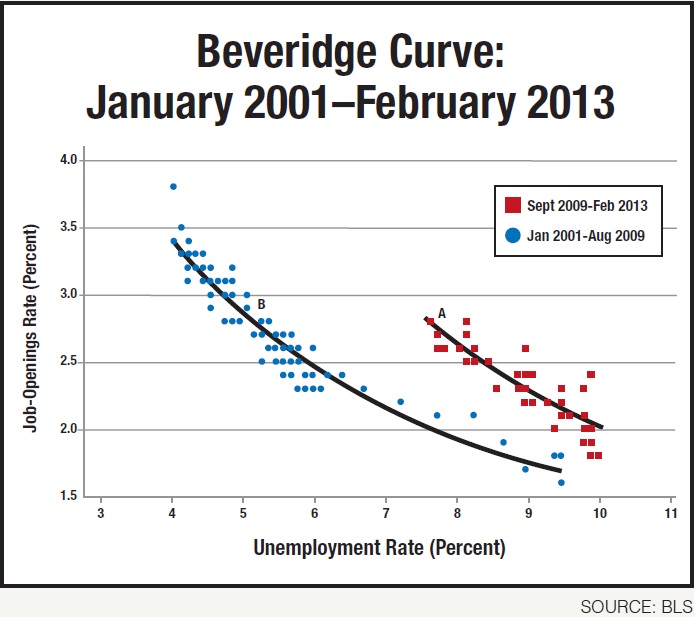
The nearby chart portrays one of the most striking shifts in U.S. labor-market data on record. Data on U.S. openings and unemployment from January 2001 to February 2013 are shown, and non-linear estimates of the Beveridge curve are provided for the periods from January 2001 to August 2009, and from September 2009 to February 2013.
In an economy with low friction, the Beveridge curve would be very close to the origin. Unemployment would tend to be low, and openings filled quickly. In an economy with large matching problems, high unemployment and high job openings could coexist, and the curve could be farther from the origin. The chart indicates that the Beveridge curve has shifted out sharply during the Obama administration.
It has been almost four years since the end of the recent recession, but the U.S. has yet to return to its previous levels of unemployment. The shift in the Beveridge curve suggests that it may never do so. The points labeled A and B illustrate why. In February 2013, the job-openings rate (unfilled jobs as a percentage of total jobs) was 2.8, a rate that would have corresponded with an unemployment rate of about 5.25 on the Beveridge curve from 2001 through August 2009. The unemployment rate in February, however, was 7.7—almost two and a half points higher.
What explains the shift in the Beveridge curve? The biggest factor is likely the massive increase in the number of workers who have become long-term unemployed. The long-term unemployed made up only 17.3 percent of all unemployed workers in December 2007; today they constitute fully 39.3 percent of all unemployed workers in the labor market. In December 2007, the average length of unemployment was 16.6 weeks; today, it is much higher, at 37.7 weeks. There is growing evidence that employers are extremely reluctant to make a job offer to persons who have been out of work for more than six months.