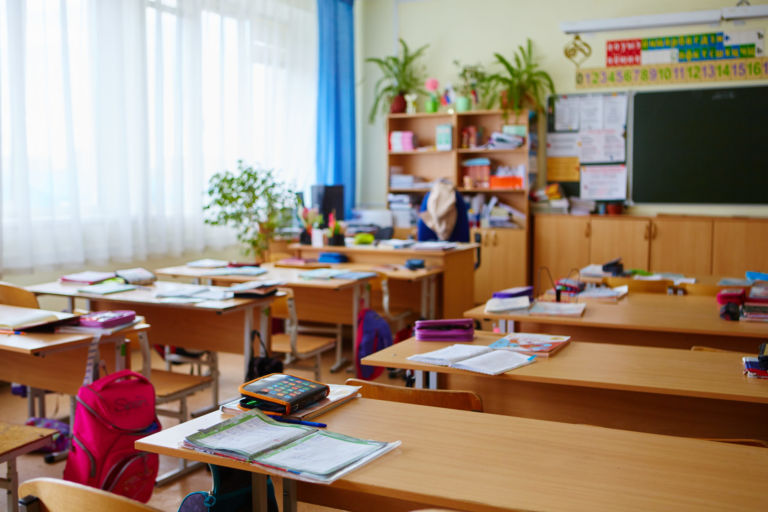
According to data released by the NC Department of Public Instruction, North Carolina public school spent an average of $9,951 per student last year, a 0.8% or $85.59 increase compared to the year before. State per-student spending increased by 2.4%, but local spending dropped by 3.7%.
Here are the unadjusted per-pupil expenditure (PPE) figures since 2006:
| Year | Agency Name | State PPE | Federal PPE | Local PPE | Total PPA | |||||
|---|---|---|---|---|---|---|---|---|---|---|
| 2020 | STATE TOTAL | $6,636.65 | $993.52 | $2,320.46 | $9,950.63 | |||||
| 2019 | STATE TOTAL | 6,479.36 | 975.38 | 2,410.30 | 9,865.04 | |||||
| 2018 | STATE TOTAL | 6,153.92 | 1,018.14 | 2,306.31 | 9,478.37 | |||||
| 2017 | STATE TOTAL | 5,956.55 | 1,016.88 | 2,198.75 | 9,172.18 | |||||
| 2016 | STATE TOTAL | 5,724.21 | 1,005.83 | 2,157.52 | 8,887.56 | |||||
| 2015 | STATE TOTAL | 5,638.39 | 1,011.13 | 2,134.82 | 8,784.34 | |||||
| 2014 | STATE TOTAL | 5,390.12 | 991.41 | 2,095.47 | 8,477.00 | |||||
| 2013 | STATE TOTAL | 5,399.64 | 1,030.02 | 2,084.55 | 8,514.21 | |||||
| 2012 | STATE TOTAL | 5,361.41 | 1,181.99 | 1,893.04 | 8,436.44 | |||||
| 2011 | STATE TOTAL | 5,161.73 | 1,354.63 | 1,897.93 | 8,414.29 | |||||
| 2010 | STATE TOTAL | 5,231.67 | 1,289.14 | 1,930.62 | 8,451.43 | |||||
| 2009 | STATE TOTAL | 5,703.70 | 884.99 | 2,123.31 | 8,712.00 | |||||
| 2008 | STATE TOTAL | 5,616.02 | 830.49 | 2,075.15 | 8,521.66 | |||||
| 2007 | STATE TOTAL | 5,273.88 | 809.49 | 1,934.05 | 8,017.42 | |||||
| 2006 | STATE TOTAL | 4,903.60 | 819.41 | 1,873.14 | 7,596.15 |

