This post builds on my previous post. In that one, I quoted a Bloomberg article today on the point that “More than half the U.S. states with laws requiring utilities to buy renewable energy are considering ways to pare back those mandates after a plunge in natural gas prices brought on by technology that boosted supply.”
I then discussed how cheap, plentiful natural gas is the game-changer in electricity, and that this revolution couldn’t have been foreseen by state leaders who passed N.C.’s mandate back in 2007.
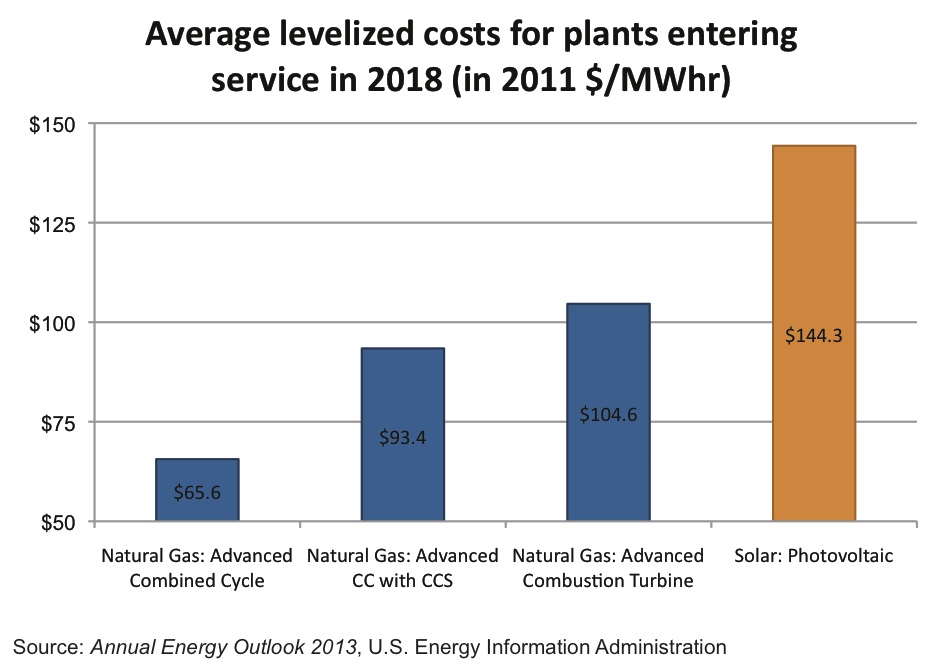
Here is how natural gas’s projected costs compare with solar’s. These data are the from the most recent Annual Energy Outlook (2013) by the U.S. Energy Information Administration. Concerning these costs, the EIA explains: “Key inputs to calculating levelized costs include overnight capital costs, fuel costs, fixed and variable operations and maintenance (O&M) costs, financing costs, and an assumed utilization rate for each plant type.”
Average levelized costs (in 2011 $/megawatthour) for plants entering service in 2018
| Plant type |
Total system levelized cost |
| Natural Gas: Advanced Combined Cycle |
$65.6 |
| Natural Gas: Advanced Combined Cycle with Carbon Control and Sequestration |
$93.4 |
| Natural Gas: Advanced Combustion Turbine |
$104.6 |
| Solar: Photovoltaic |
$144.3 |