- Locke’s survey of parents asked questions on the topics of the Parents’ Bill of Rights and education spending
- Parents polled supported Parents’ Bill of Rights legislation by better than a two-to-one margin (62 percent to 27 percent), and this support was strong across the board
- When told North Carolina spends $12,345 per student, only 26 percent of respondents said North Carolina spends too little on education, and the plurality (42 percent) said it was “about the right level of spending”
Do the views of parents and school board members converge or diverge on the major issues of the day? What do parents and school board members think about politics in the classroom or parents’ ability to access their child’s medical records? Those were some of the questions the John Locke Foundation hoped to answer when it commissioned polls this spring of school board members and parents. Results of these polls were published in Part 1 and Part 2 of this series. In the third and final part of this series, we discuss the responses of parents on two timely topics, the Parents’ Bill of Rights and education spending.
What Do Parents Think About the Parents’ Bill of Rights?
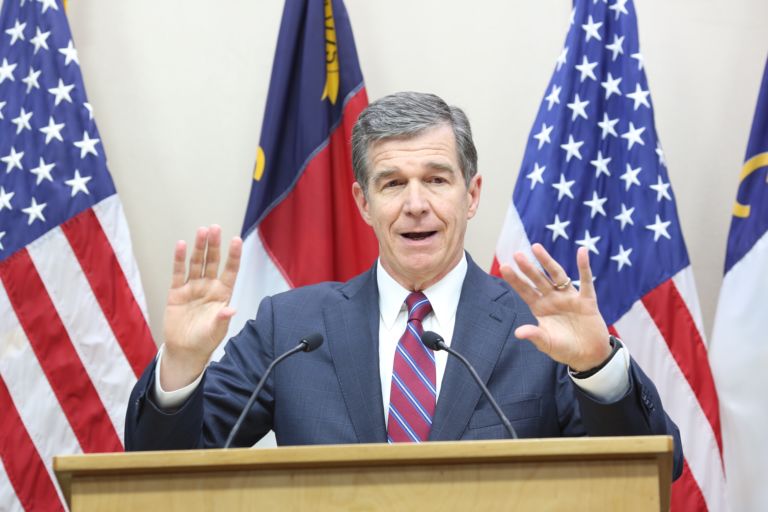
Parents’ Bill of Rights (PBR) legislation has been introduced in both the 2022 and 2023 legislative sessions (see discussions here and here). Such legislation is meant to enshrine parental rights and restore parental authority in the classroom and in child rearing. In 2022, House Bill 755 passed the House but died in the Senate. In 2023, Senate Bill 49 passed both chambers, but on July 5, Gov. Roy Cooper vetoed it. The bill is currently waiting to be scheduled for a veto override vote in the House.
Our spring poll asked parents to share which statements best reflected their views regarding the Parents’ Bill of Rights. The chart below summarizes parental responses.
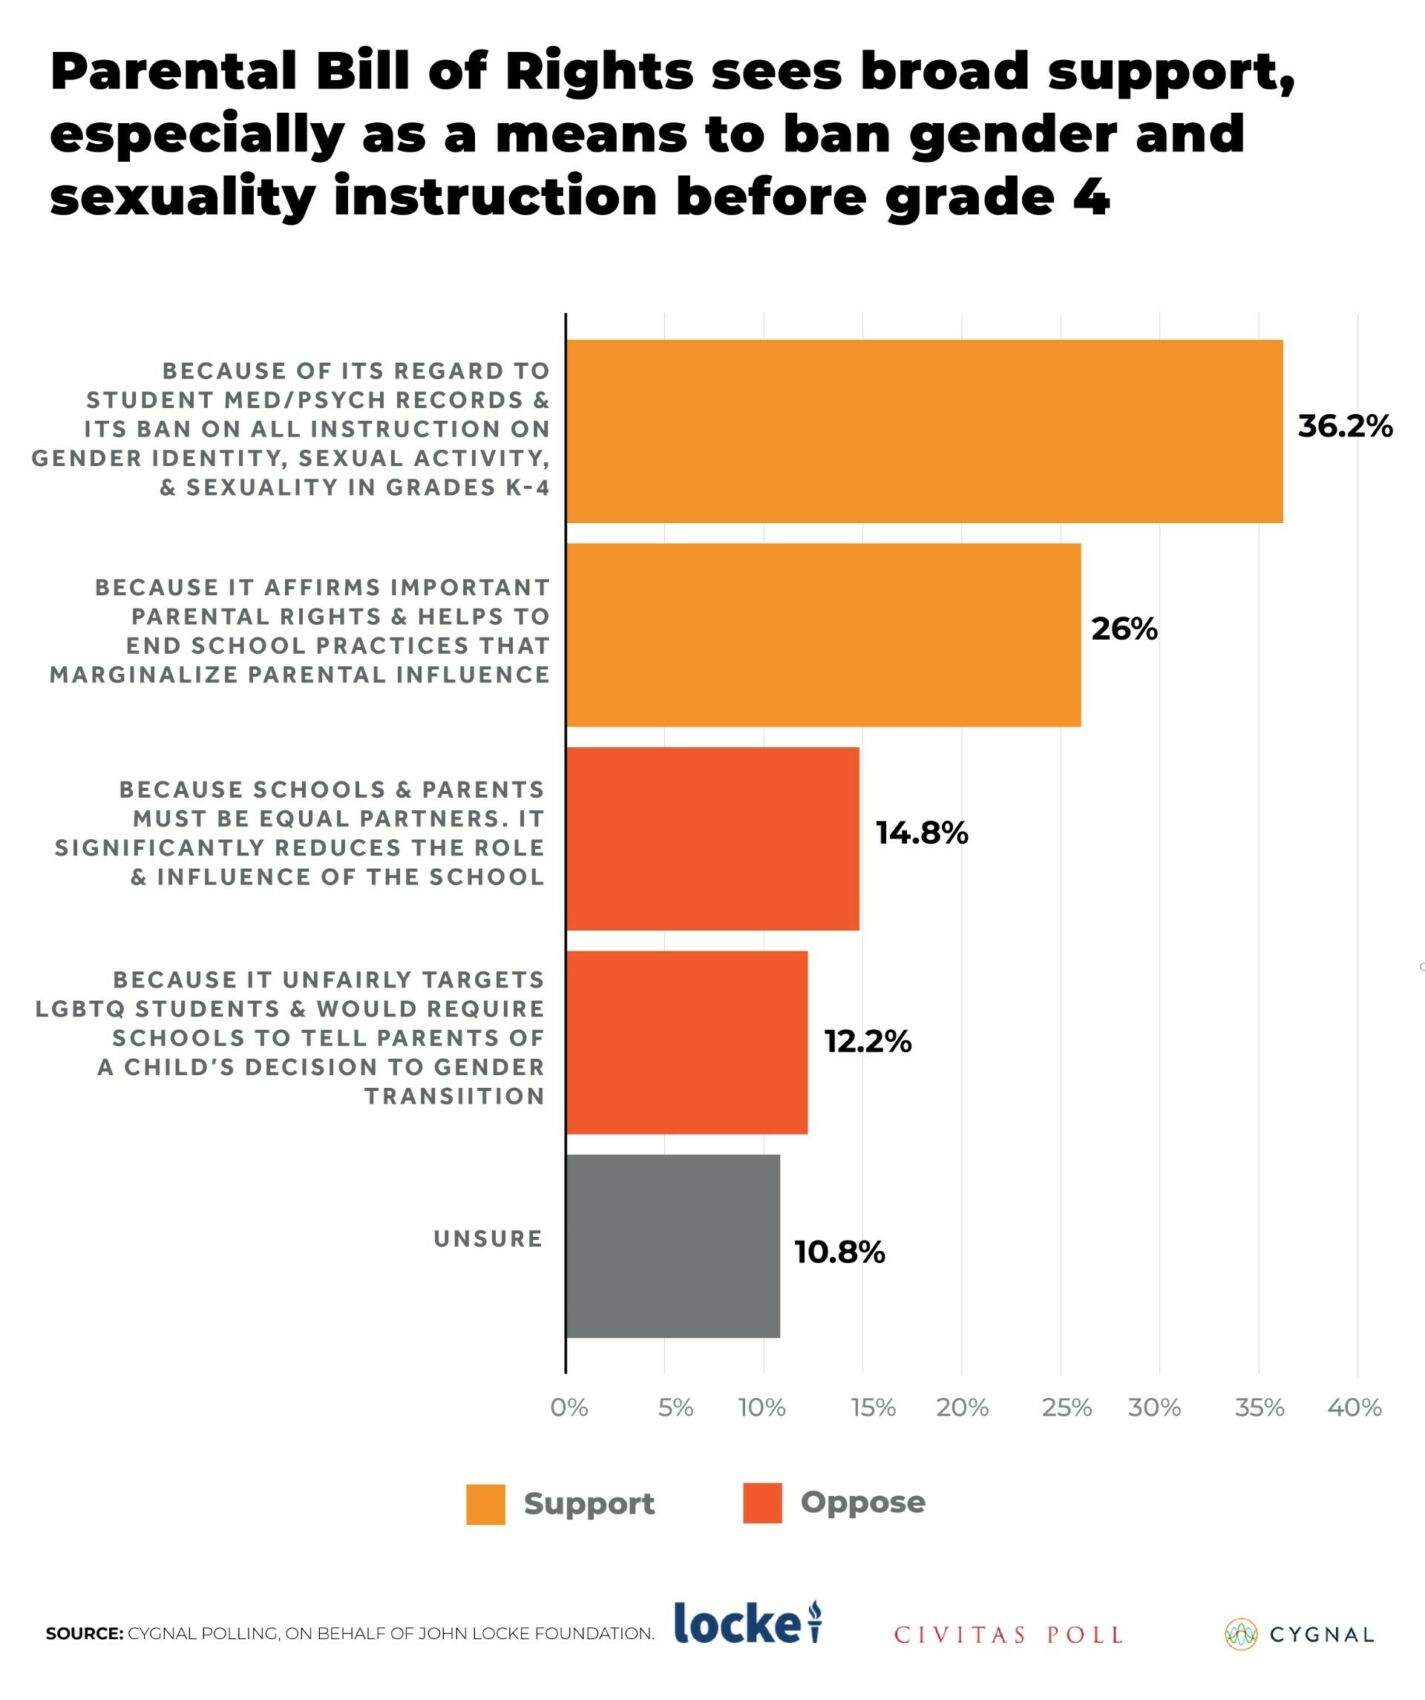
How did parents respond? Approximately 62 percent of respondents supported the Parents’ Bill of Rights, while only about 27 percent of respondents opposed it. Eleven percent of respondents were undecided.
Support for PBR as a tool to enshrine parental rights and aid their access to their child’s student records was strong across the board. Affirmative responses were particularly strong among Democrats (69 percent) and Republicans (63 percent), while a little less than half of Independents (45 percent) supported PBR legislation (the only category with less than majority support for PBR). Support for PBR was also very strong among urban parents (70 percent), college-educated parents (70 percent), and parents with annual incomes greater than $100,000 (69 percent).
The majority of PBR supporters (58 percent of supporters) said they support the legislation because it “enumerates important parental rights regarding student medical and psychological records and bans instruction on gender identity, sexual activity and sexuality in kindergarten through grade four.”
Opposition to PBR was divided between two reasons: those who believe the bill reduces the role and influence of the school (15 percent of parents polled, and just over half of those who were opposed to PBR) and those who believe the legislation unfairly targets LGBTQ students (12 percent of parents polled).
Overall, respondents favored PBR legislation by better than a two-to-one margin. Support was strong and broad. In the culture, opposition to PBR legislation is driven primarily by LGBTQ advocates. The poll found, however, few respondents who opposed PBR because it “targets LGBTQ students.” They include Republicans (9 percent), Democrats (11 percent), Independents (20 percent), 18–34 age cohort (12 percent), 35–49 age cohort (14 percent), college-educated parents (12 percent), and urban parents (10 percent). While the public discussion is vocal, actual support levels seem less formidable.
What Do Parents Think about Educational Funding?
In addition to questions about the Parents’ Bill of Rights, the parents poll also asked two questions about school funding. The first question asked respondents for their views of school spending and educational outcomes.
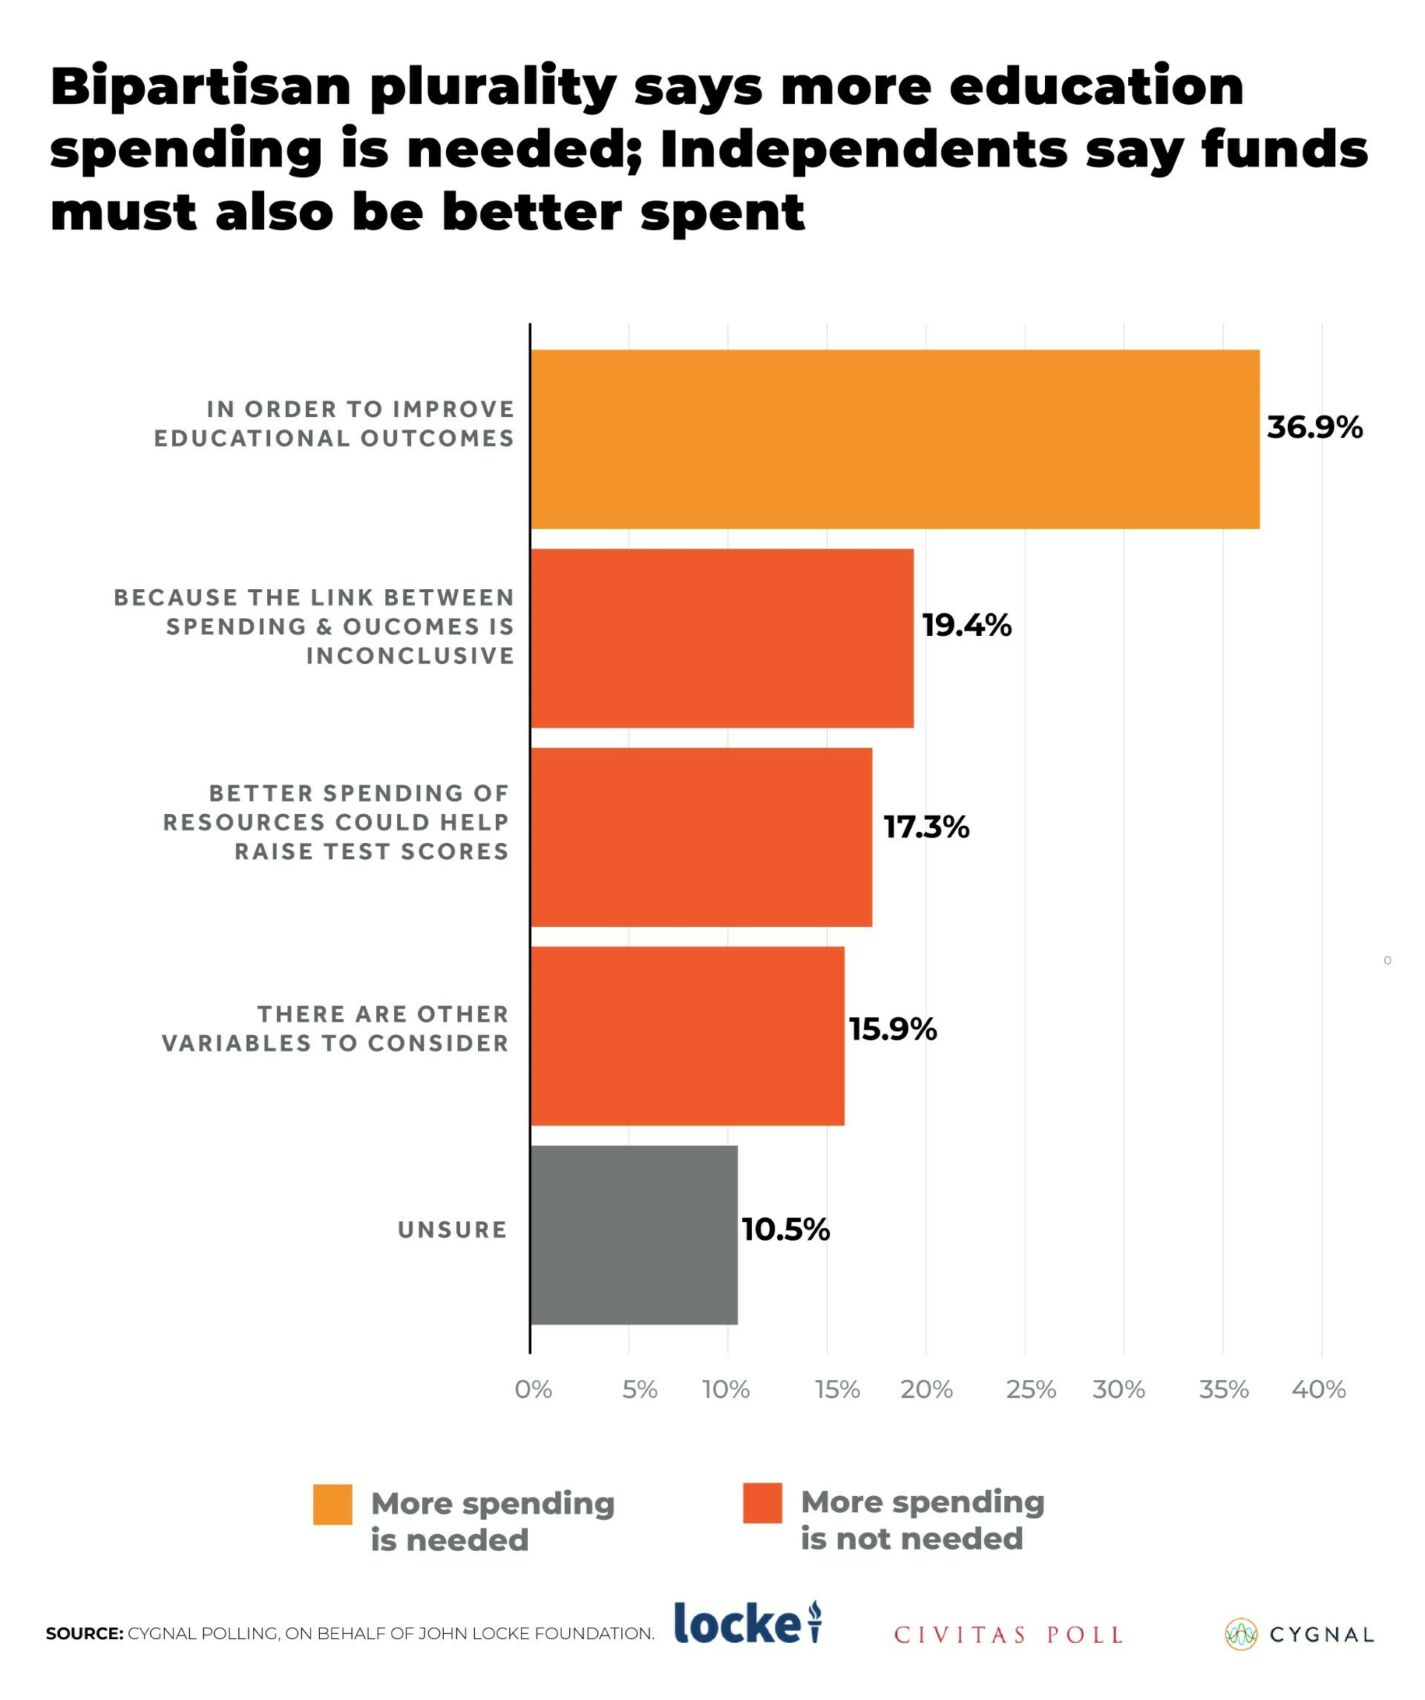
The option that best reflected respondents’ views on spending and educational outcomes was the idea that more money is necessary to achieve better outcomes. Pluralities of Democrats (40 percent), Republicans (39 percent), and Independents (28 percent) said more education funding was needed to improve educational outcomes.
That response was also the plurality response for all categories except two. Males with no college education were divided between that response and “Additional funds will not result in improvements in educational outcomes since the linkage between spending and outcomes is inconclusive” (27 percent apiece). The dominant answer for respondents with incomes of $70K–$100K was that “School spending is not unimportant but there are other variables that schools should look at when assessing influences on educational outcomes.” (It provides an interesting differentiation from the 41 percent of those with incomes over $100K who supported more funding.)
None of the four other responses garnered more than 20 percent, with nearly 11 percent reporting being “Unsure.”
After asking about educational funding and educational outcomes, the poll informed respondents that North Carolina spends approximately $12,345 per student and then asked: “Do you think that’s too little spending, about the right amount of spending, or too much spending?”
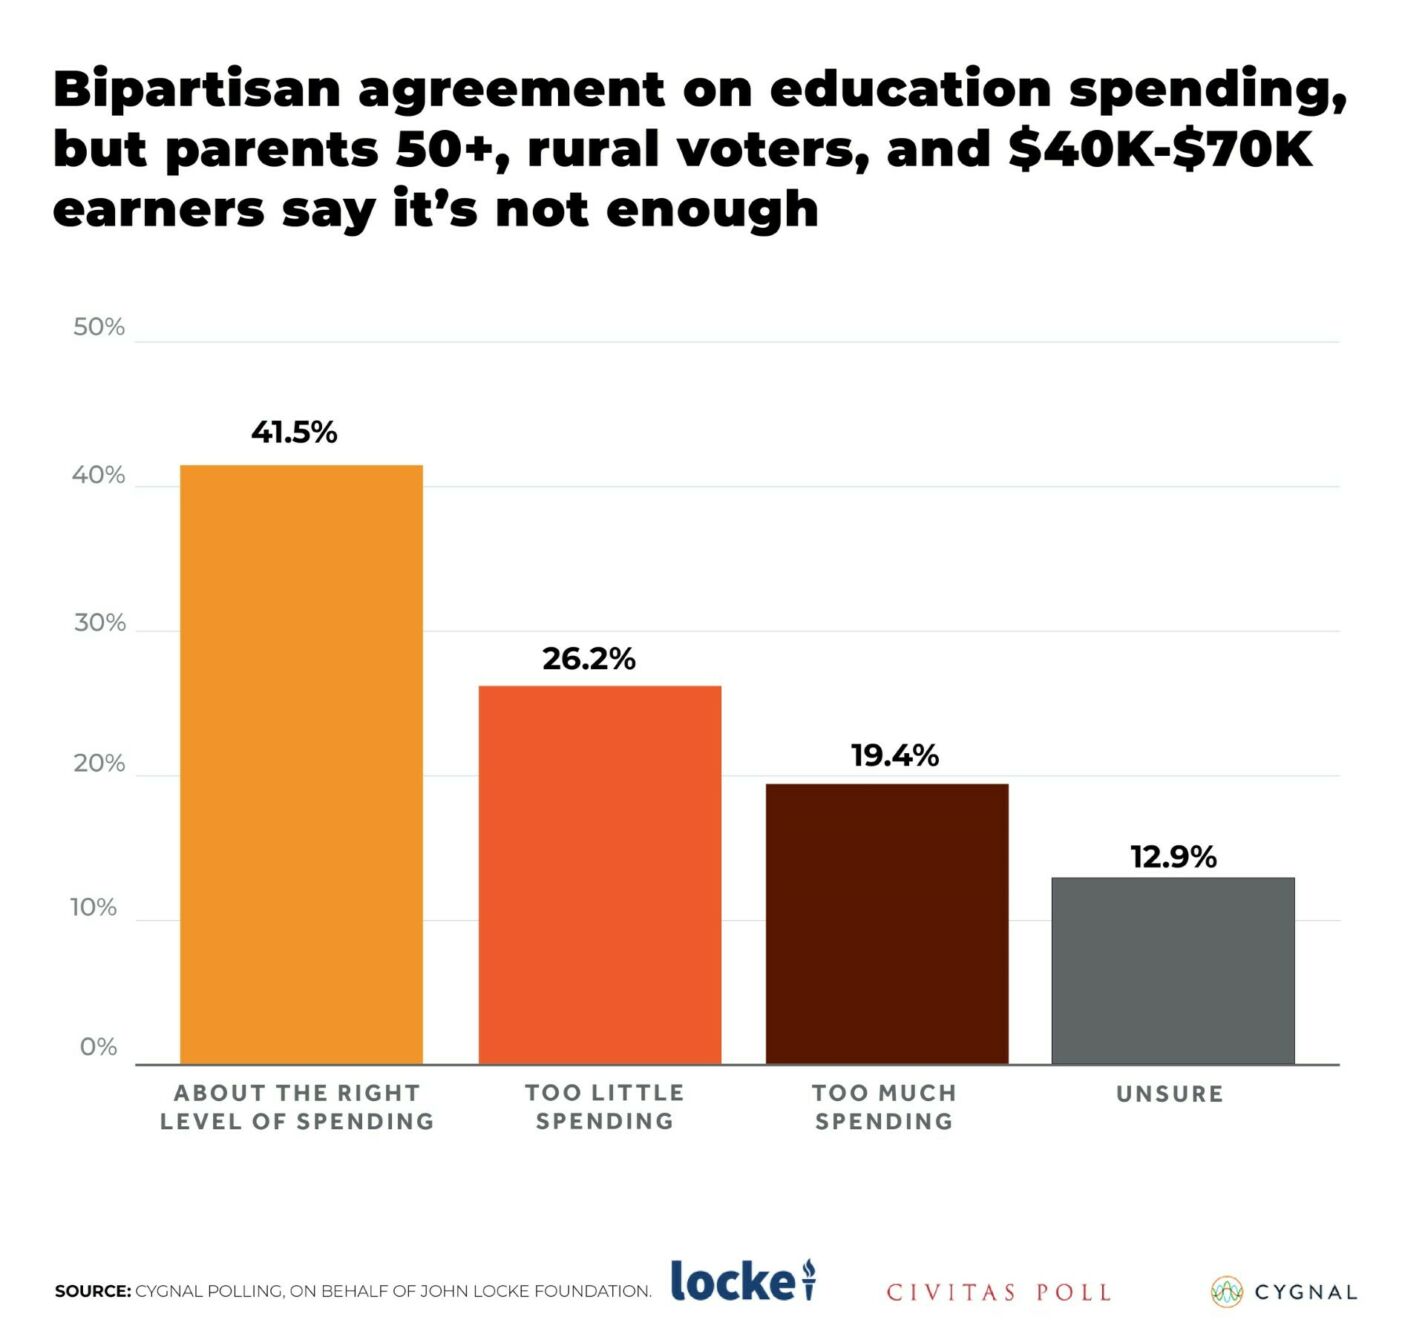
The change in results was significant. In the previous question, 37 percent of respondents said North Carolina must spend more money to improve educational outcomes. After learning how much North Carolina is spending per student, 26 percent of respondents said it was “too little spending” — a decline of 11 percentage points. In addition, only about one in five respondents (19 percent) said $12,345 per student was “too much spending,” while another 13 percent said they were unsure.
Interestingly, a plurality of respondents (42 percent) thought $12,345 per student was “about the right level of spending,” including a surprising 49 percent of Democrats. They were joined by about 39 percent of Republicans and 29 percent of Independents (both pluralities). “About the right level of spending” was the strongest response across nearly all categories of respondents except for those age 50 and over, rural parents, and those with annual incomes of $40K–$70K. It was particularly strong among the higher-income groups, those earning $70K–$100K (50 percent) and those earning over $100K (47 percent).
Lessons Learned
So what can we learn from these poll results? Two findings stand out. Parents supported PBR legislation by a wide margin, over two to one. Contrary to the dominant political narrative, parents remain divided about spending and its impact on educational outcomes. When told how much North Carolina spends per student, a plurality of respondents (42 percent) thought North Carolina had “About the right level of spending.” In addition, the percentage of respondents calling for additional funding declined by 11 percentage points.
The findings suggest that while parents remain dissatisfied with educational outcomes and how schools are administered, parents don’t think more money is the solution. It’s a message that deserves to be part of the current discussion on public education in North Carolina.