A new report from the Brookings Institution1 reiterated encouraging findings on U.S. energy-related emissions by the U.S. Energy Information Administration,2 the National Oceanic and Atmospheric Administration,3 and some international environmental organizations.4 Since 2000, carbon dioxide (CO2) and other emissions in the United States are down.
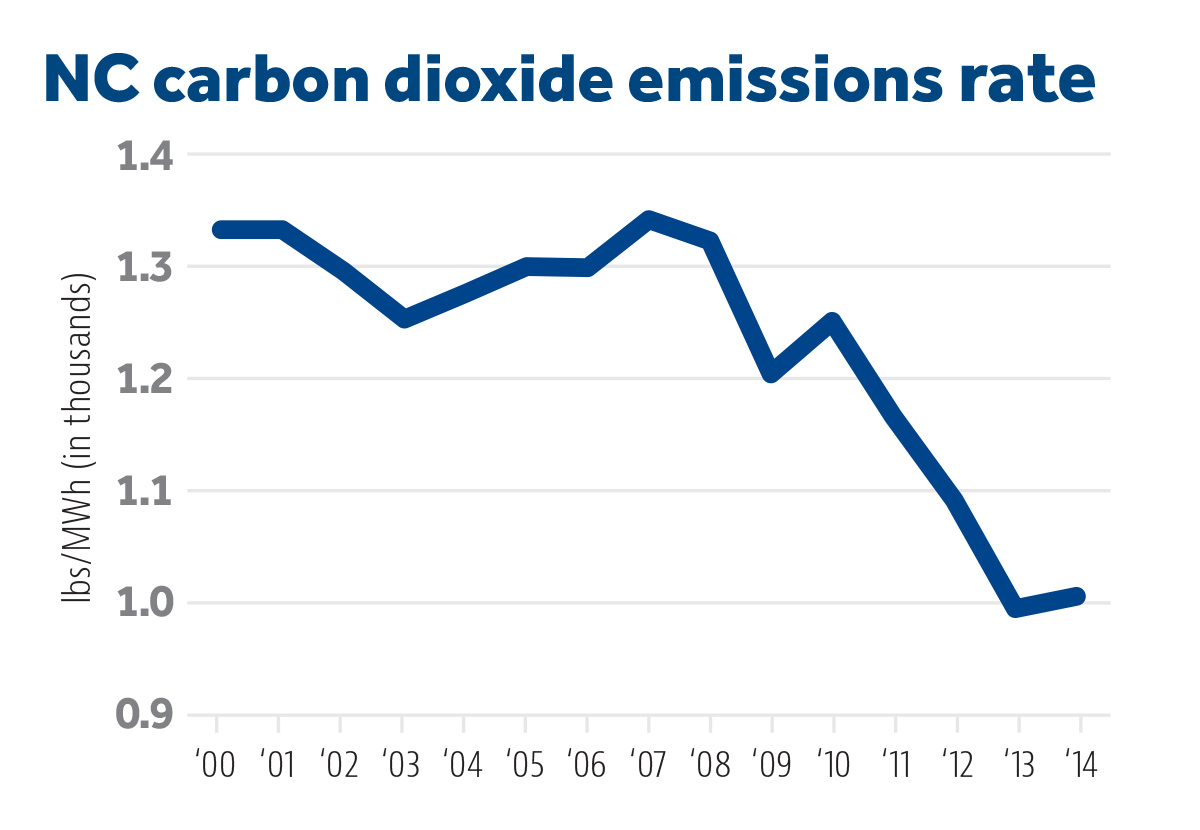
In North Carolina, the report showed, CO2 emissions are down 14.6 percent since 2000.5 North Carolina’s rate of “decarbonizing” its economy is greater than four-fifths of the 50 U.S. states — ranking it in the top 10.6
Emissions are falling, the report showed, as the economy is growing. Nationally, the economy grew by 30 percent since 2000, while emissions fell 10 percent. In North Carolina, the economy grew by 26.3 percent while emissions fell by 14.6 percent.7
Economic growth and market freedom lead to a cleaner environment
The Brookings report made that result seem almost counterintuitive, using the term “decoupling” of economic growth from emissions — “a task some have said was impossible.”8 Nevertheless, the idea that economic growth and emissions are invariably linked without centralized government control to break them apart is not supported by economic consensus.
Cleaner and cleaner air has in fact been a reliable trend in freer societies with faster-growing economies, whereas growing pollution is a trend in command-and-control economies. Market economies reward innovators who produce more and waste less, which has the unanticipated side benefit of encouraging cleaner production. Centrally controlled economies block this process and lack this entrepreneurial vision.9
Economists use something called the Environmental Kuznets Curve to describe this -relationship. Initially developing economies necessarily produce greater pollution than the pre-existing state of nature. When societal wealth, life expectancies, and productivity reach a certain point, however, people begin valuing cleaner environments, while technological advances and post-development shifts in industry produce cleaner and more efficient outcomes.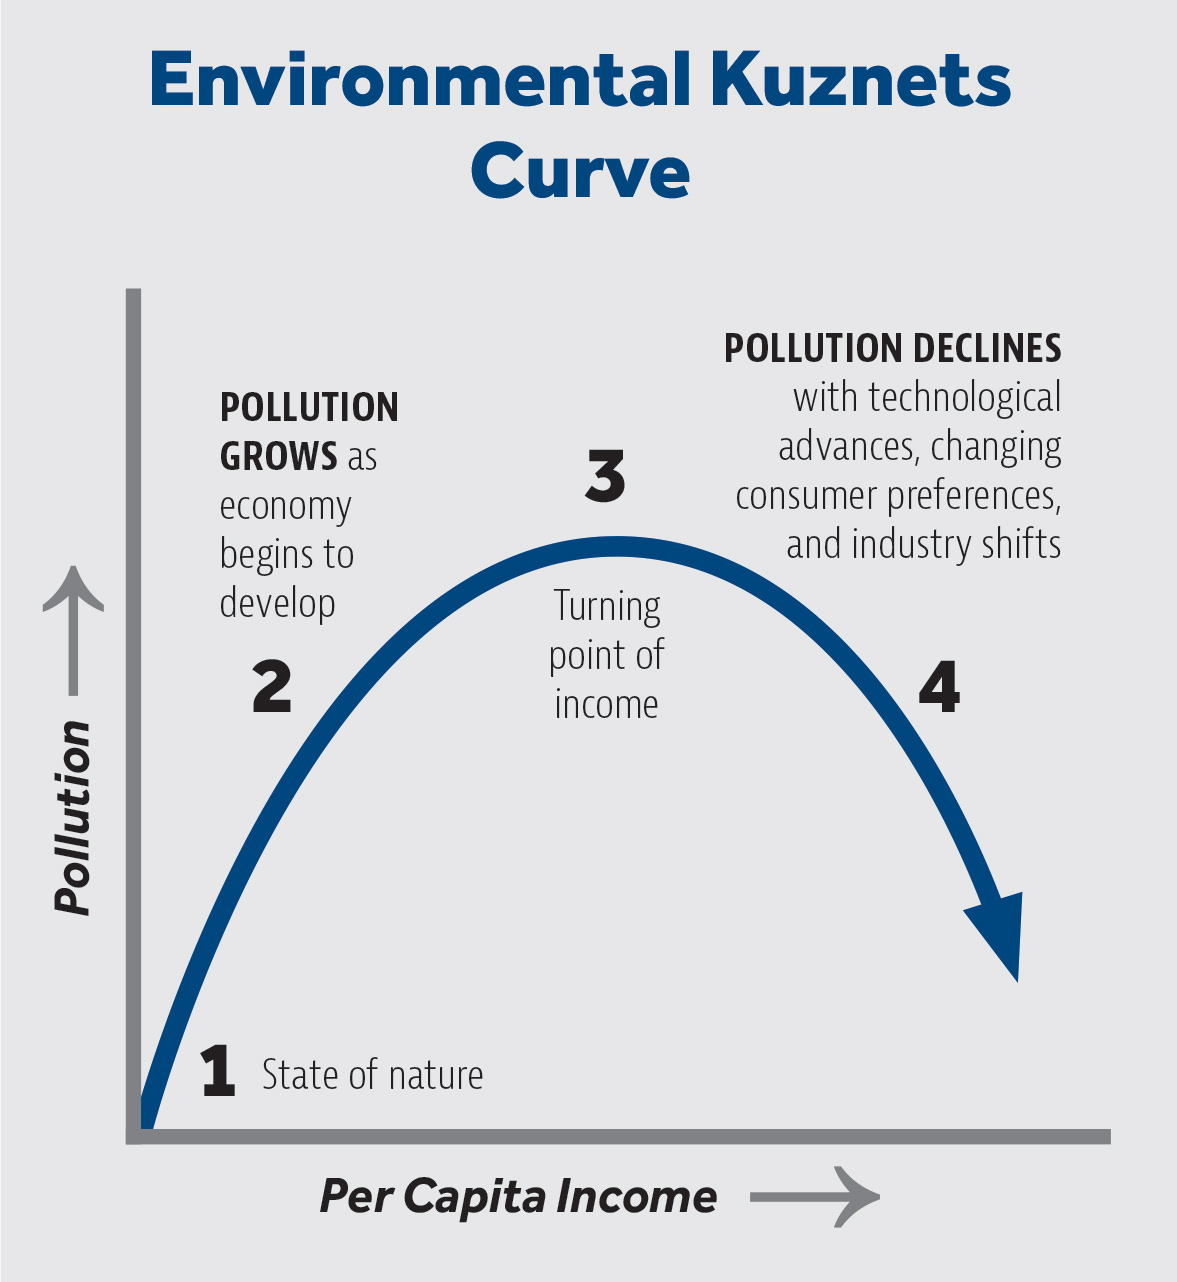
Those outcomes are not inevitable, however. They require well-established property rights and protections of market freedom. Government distorting the market, such as by subsidies or by other cronyist interferences such as purchase mandates, hinder rather than help improvement in environmental quality.10
Market Forces Leading to Emissions Reductions
Reasons identified by Brookings for falling emissions over the 21st century are directly market-oriented as opposed to government-driven:
Market trends
Technological change and consumer preferences favor less “carbon-intensive” goods and services. A growing service sector in the economy’s industry structure also lowers emissions.
North Carolina’s service sector saw one of the nation’s largest expansions, growing from 63 percent of Gross Domestic Product (GDP) to 72 percent. Neighboring Georgia and Virginia were other states with relatively high growth in the service sector.11
Market-driven price changes in energy sources
Since 2000, especially because of “the decline of natural gas prices made possible by the ‘fracking’ revolution,” states have moved into lower-emissions fuel sources “such as through the substitution of natural gas for coal in power plants.”12 The other significant low-emissions fuel source the report notes is nuclear.
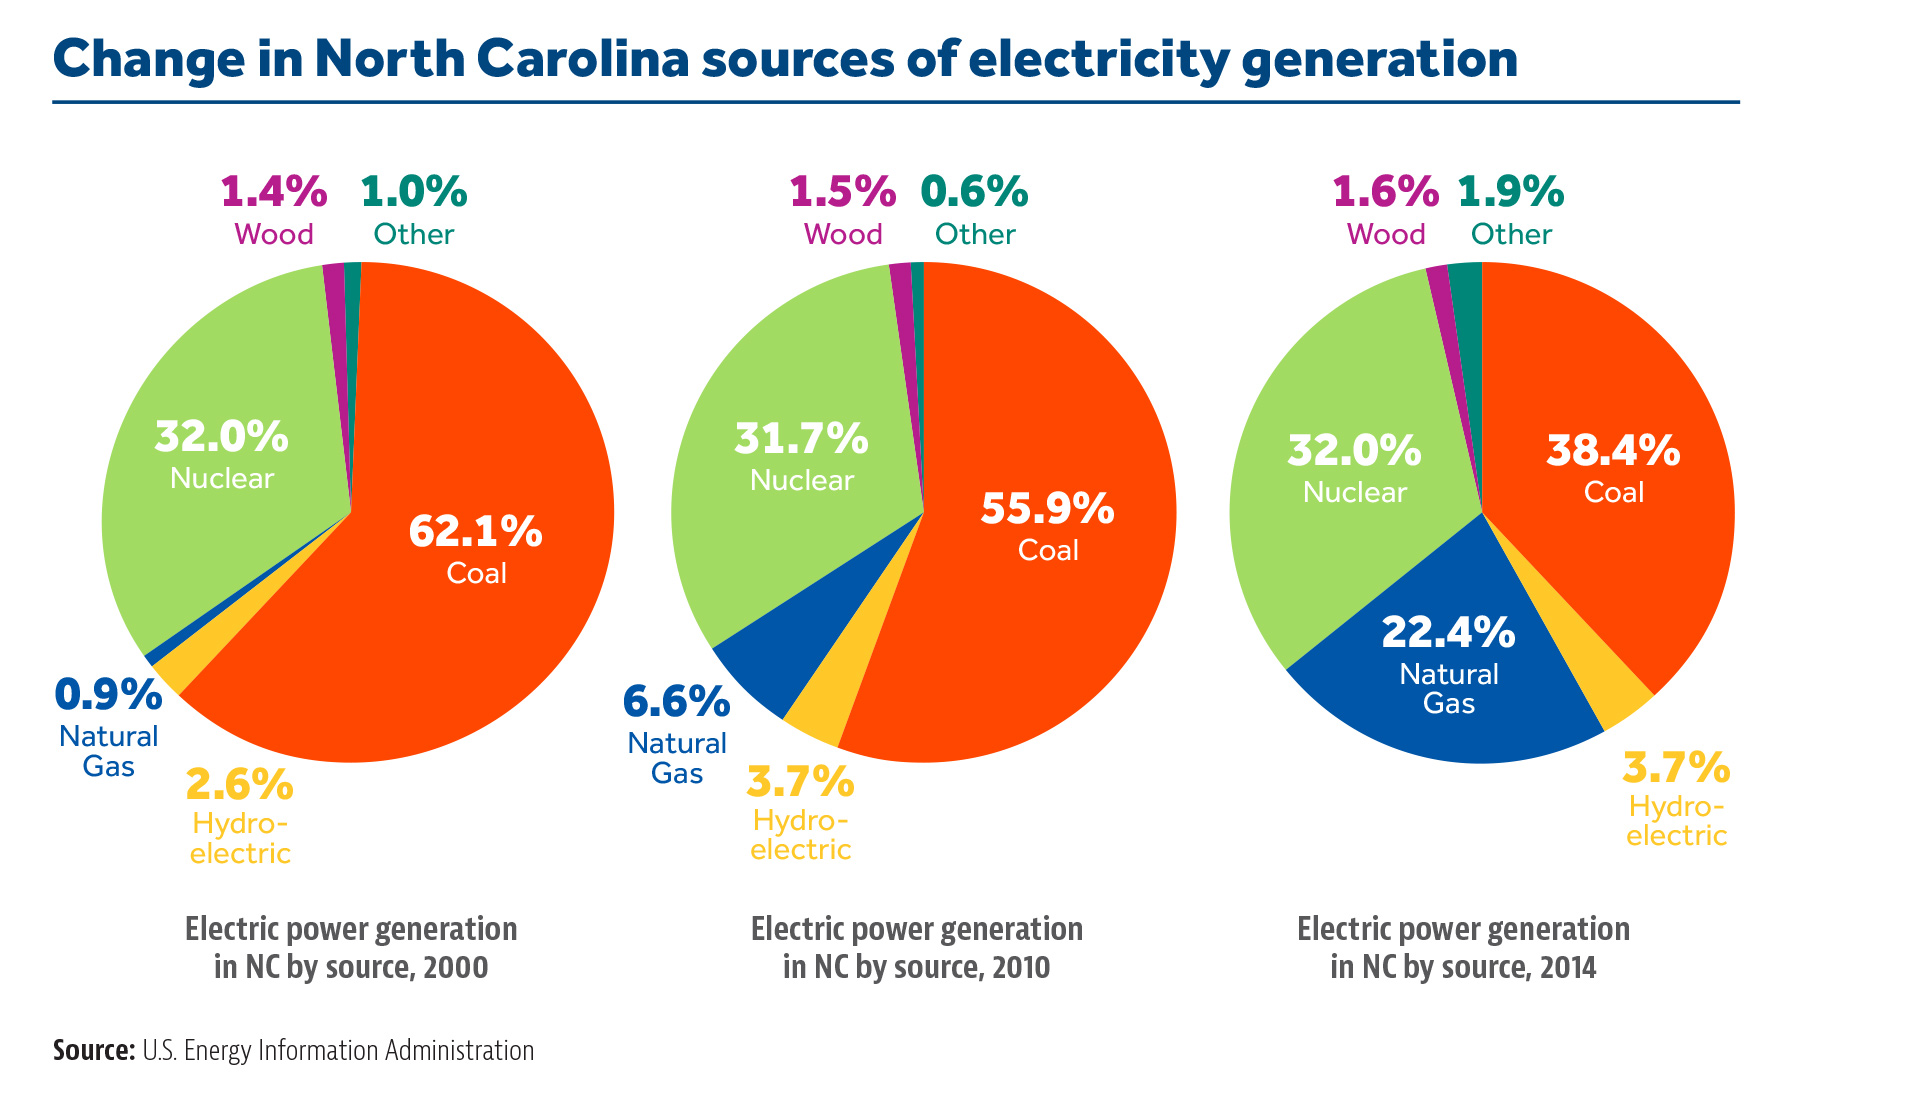
The report credited emissions reductions in North Carolina “in large part” from sourcing more of its electricity generation from nuclear (32 percent) and a growing percentage from natural gas (22 percent) and away from coal (38 percent).13
No significant impact on CO2 reduction through renewable energy
The Brookings report included a brief note about renewable energy resources such as wind and solar. Those sources “have yet to register as broad an impact” as expected. It found, “this analysis does not find a strong statistical relationship between states’ emissions reductions and solar and wind’s share of power generation.”14
In fact, the report found that in most of the states that saw the greatest growth of wind or solar in terms of the states’ share of electricity generation, “carbon emissions rose from 2001 and 2014, as well as in the period since 2008 when wind and solar development has taken place in the country.”15 (Emphasis added.)
That period since 2008 is also when the decline in natural gas prices owing to fracking began.
The report hypothesizes that “it is likely renewables will soon contribute” to emissions reductions and suggests that what reductions renewables could be already having are “probably being undercut by other factors.”16 It doesn’t identify any factors17 nor give an idea how soon18 renewables would begin contributing.
Conclusion: Free Markets Are Producing Results That Governments Aren’t
The top priority for electricity policy in North Carolina is providing reliable power while keeping consumers’ costs as low as possible. Electricity is a basic human need.
It is not the case, however, that North Carolinians face a hard choice of higher emissions for least-cost, reliable electricity. This supposed tension, used to justify attempts at greater state government interventions in energy policy,19 does not actually exist.
Nor is it the case that state government must strike a balance between least-cost, reliable electricity and lower emissions. Economic theory warns that would hinder emissions reduction, not help. Meanwhile, it would impose higher electricity costs than otherwise on poor North Carolina families, small businesses, and everyone else.20
Instead, energy-based emissions in North Carolina have fallen at a greater rate than in most other states. Technological innovation in energy sourcing — namely, the fracking revolution leading to significant price reduction in natural gas — is responsible for a large part of this emissions decline.
Market trends, a growing service sector, and consumer preference have also been contributing to the emissions decline. None of those factors is dictated, let alone is foreseeable, in the halls of power in Raleigh.
In fact, states that tried to force the issue by mandating the greatest reliance on renewable energy sources have by and large failed to realize emissions reductions enjoyed by the rest of the country.
End Notes
1. Devashree Saha and Mark Muro, “Growth, carbon, and Trump: State progress and drift on economic growth and emissions ‘decoupling’,” The Brookings Institution, December 8, 2016, https://www.brookings.edu/research/growth-carbon-and-trump-state-progress-and-drift-on-economic-growth-and-emissions-decoupling.
2. Perry Lindstrom, “U.S. energy-related carbon dioxide emissions in 2015 are 12% below their 2005 levels,” Today In Energy, United States Energy Information Administration (EIA), May 9, 2016, http://www.eia.gov/todayinenergy/detail.cfm?id=26152.
3. J.A. de Gouw, D.D. Parrish, G.J. Frost, M. Trainer, “Reduced emissions of CO2, NOx, and SO2 from U.S. power plants owing to switch from coal to natural gas with combined cycle technology,” Earth’s Future, Vol. 2, Issue 2, February 2014, pp. 75–82, http://onlinelibrary.wiley.com/doi/10.1002/2013EF000196/full.
4. Q.v., endnote 1 in Saha and Muro cites Nate Aden, “The Roads to Decoupling: 21 Countries Are Reducing Carbon Emissions While Growing GDP” (Washington: World Resources Institute, 2016); and Sophie Yeo and Simon Evans, “The 35 Countries Cutting the Link Between Economic Growth and Emissions” (London: Carbon Brief, 2016).
5. Saha and Muro, Figure 3.
6. Saha and Muro, Figure 6.
7. Saha and Muro.
8. Saha and Muro.
9. See discussion in Julian Simon, “Pollution Today: Specific Trends and Issues,” Chapter 17, The Ultimate Resource 2, Princeton, New Jersey: Princeton University Press, 1996; viewable online at http://www.juliansimon.com/writings/Ultimate_Resource/TCHAR17.txt.
10. For discussion, see, e.g., Bruce Yandle, Maya Vijayaraghavan, and Madhusudan Bhattarai, “The Environmental Kuznets Curve,” PERC Research Study 02-1, Property and Environmental Research Center, May 2002, http://www.perc.org/articles/environmental-kuznets-curve. The curve takes its name from economics Simon Kuznets, who described in 1954 a similar relationship between economic growth and income inequality (worsens initially, then declines after a certain turning point).
11. Saha and Muro.
12. Saha and Muro.
13. Saha and Muro.
14. Saha and Muro.
15. Saha and Muro.
16. Saha and Muro.
17. Charles Frank, “The Net Benefits of Low and No-Carbon Electricity Technologies,” Working Paper 73, Global Economic Development, Brookings, May 2014, http://www.brookings.edu/research/papers/2014/05/low-carbon-electricity-technologies-frank; see discussion in Jon Sanders, “Natural Gas: Low-cost energy source that curbs emissions and land impacts,” Spotlight No. 476, John Locke Foundation, June 12, 2016, https://www.johnlocke.org/research/spotlight-476-natural-gas.
18. For the long history of “soon” and renewable energy potential, see “Will renewables be cost-competitive any time soon?”, Institute for Energy Research, April 1, 2009, http://instituteforenergyresearch.org/studies/will-renewables-become-cost-competitive-anytime-soon-the-siren-song-of-wind-and-solar-energy.
19. “Provide improved air quality” was one of the four express purposes behind the establishment in 2007 of North Carolina’s Renewable Energy and Energy Efficiency Portfolio Standards (REPS). See discussion in Jon Sanders, “Power to the People: End SB 3 with its expensive, regressive renewable energy portfolio standard,” Spotlight No. 434, John Locke Foundation, March 28, 2013, http://www.johnlocke.org/research/power-to-the-people-end-sb-3-with-its-expensive-regressive-renewable-energy-portfolio-standard.
20. What was not one of the four express foundational purposes of North Carolina’s REPS: creating jobs in renewable energy. This post hoc justification of REPS via job creation is highly indicative that renewable energy sources are more expensive. It admits — in order to propose as a strength (job creation) — that those sources are more inefficient; i.e., that they require more labor to produce equivalent amounts of energy as traditional sources. See discussion in Chris Juchao and David Solan, “Employment Estimates in the Energy Sector: Concepts, Methods, and Results,” The Energy Policy Institute, Center for Advanced Energy Studies, March 2013, http://www.ourenergypolicy.org/wp-content/uploads/2015/06/employment-estimates-in-the-energy-sector-concepts-methods-and-results.pdf, and discussion in Jon Sanders, “Apply some good horse-sense to ‘economic impact’ studies,” Rights & Regulation Newsletter, John Locke Foundation, February 25, 2016, http://www.johnlocke.org/update/apply-some-good-horse-sense-to-economic-impact-studies.