How much does it cost to educate a child in the local public schools? The answer to that question may depend on who you ask.
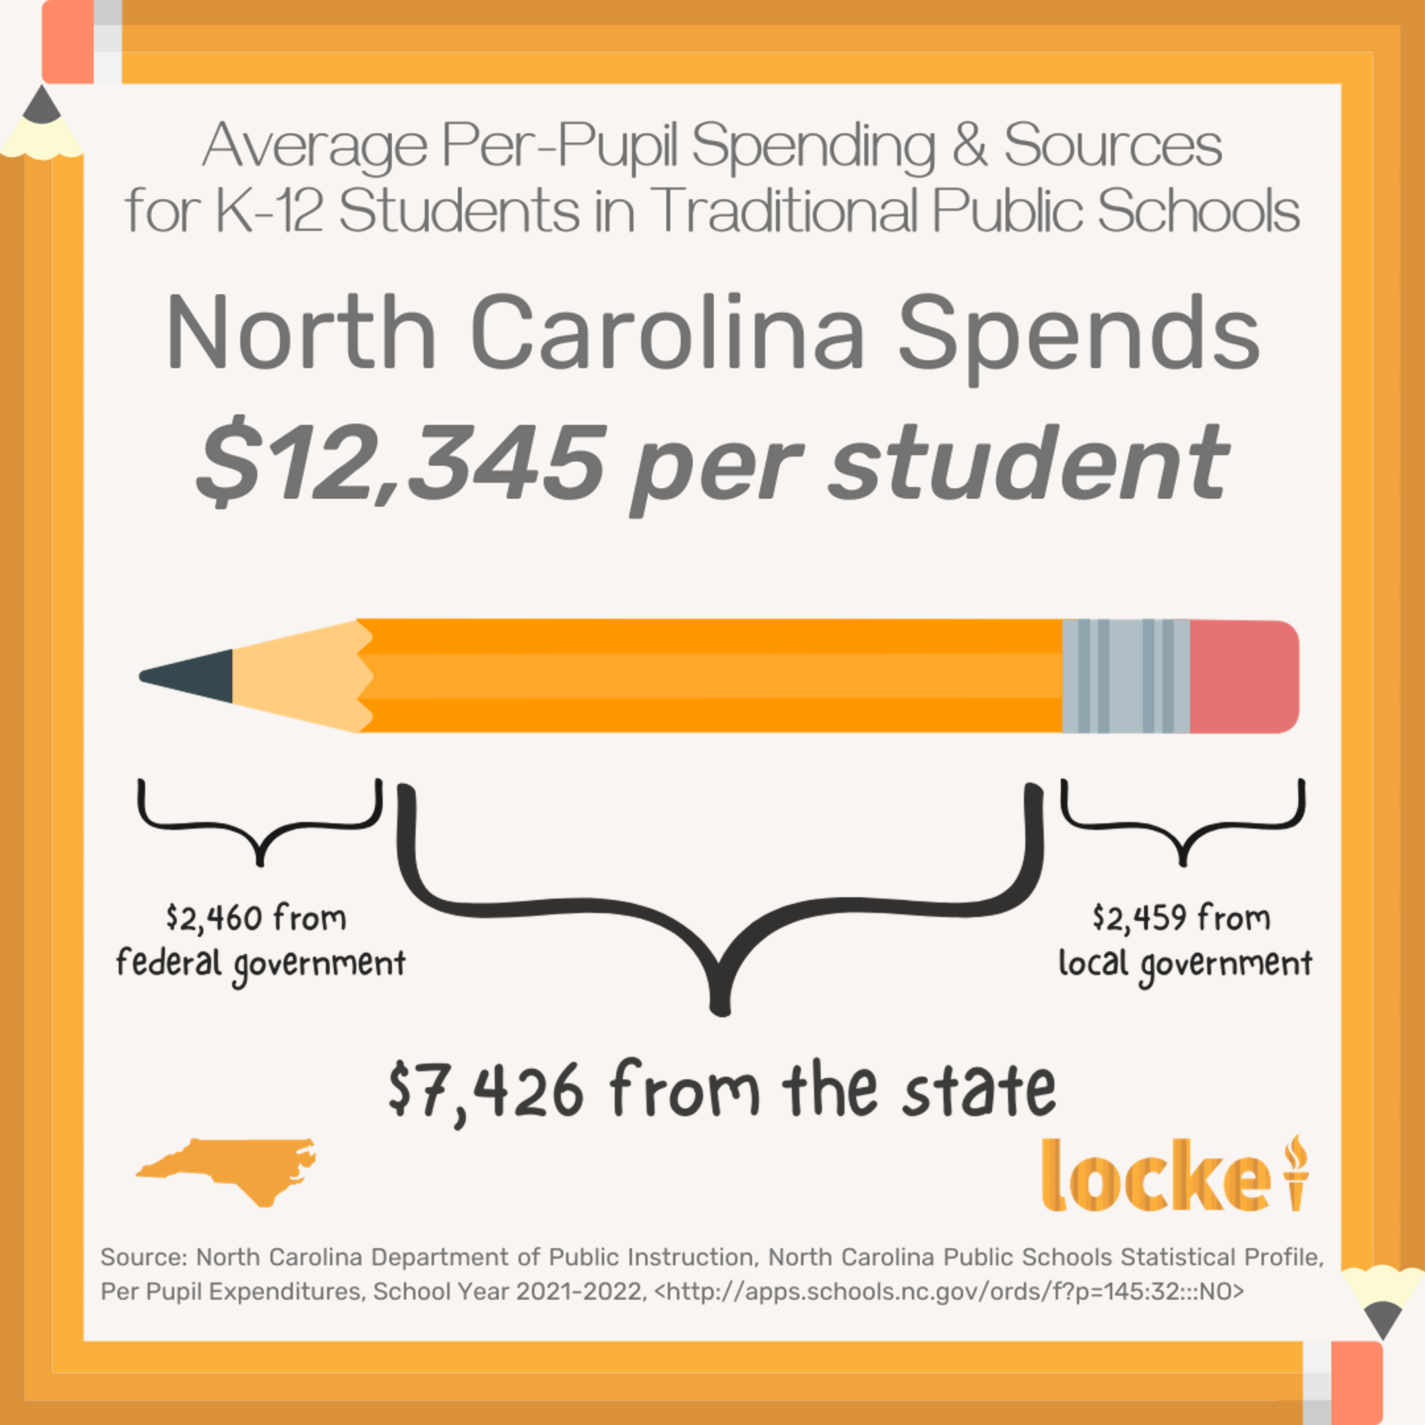
On average in 2022, North Carolina spent $12,345 per student. The majority of the total amount was state funding ($7,426) followed by federal ($2,460) and local funds ($2,459). If you ask about the costs of individual school districts, you’ll get a lot of different answers.
The table below provides spending for the ten highest- and lowest-spending school districts in North Carolina. It provides a ranking of per-capita personal income by county and also the number of private schools by county.
Several observations can be gleaned from the table. First, contrary to conventional wisdom, the highest-spending districts, generally speaking, are not financially well-off school districts. The average county per-capita ranking is 60 out of 100 counties. The additional money may come from federal Title I aid, state monies to help disadvantaged students and areas and federal Covid aid.
Second, the table shows great variability in spending between districts. The majority of school districts in the highest-spending category are districts that have not performed well on state and national tests. Certain questions emerge from these realities: Why are districts that spend below the state average outperforming those that spend almost twice as much? Does the outcome mean the extra money North Carolina and the federal government spend to help equalize opportunity and outcomes is not having the desired effect? Those questions have dominated the policy debate for the last several decades.
Instead of waiting for politicians to decide, parents want to choose the best educational option for their child. The recent expansion of North Carolina’s Opportunity Scholarship Program is a step in the right direction and it will put parents in the driver’s seat regarding their child’s education.
How much is a private school education in North Carolina?
According to Private School Review, the average private-school tuition in North Carolina is $10,442. That’s almost $2,000 less than what North Carolina spends per student ($12,345) and considerably less than the per-pupil spending in the highest-spending districts.
That’s a favorable number. It’s even more favorable when you realize the majority of Opportunity Scholarship students attend small parochial schools where tuition ranges from $5,000 to $8,000.
That’s good news. However, emerging evidence suggests the desired expansion may be limited or delayed. Initial reports on the number of new applicants suggests demand will far exceed the available funding. In addition, families in many of the highest-spending districts lack alternatives to the public schools.
Parents in Hyde or Tyrrell County may apply for an Opportunity Scholarship only to find their options are limited because their area has too few private schools. That’s not so in lower-spending districts. While the 10 top-spending school districts are home to 24 private schools, four districts have no private schools, one has two , and two other districts have one private school each. Meanwhile, families in the 10 lowest-spending districts can choose from 113 private schools.
It will take a while for the desired changes to emerge. Nevertheless, be assured school district spending — and performance — will continue to influence the contours of the Opportunity Scholarship Program, and vice versa.
And, that’s a good thing.
Comparison of Select School Districts, 2021-22
Measures Include: Per-Pupil Spending, Per-Pupil Expenditure Ranking, Personal Income by County Ranking, and Number of Private Schools by County
| District Name | State Per-Pupil Spending | Total Per-Pupil Spending | Total Per-Pupil Expenditure Ranking | Per-Capita Personal Income by County Ranking | Number of Private Schools in County |
|---|---|---|---|---|---|
| Hyde County Schools | $18,496 | $27,920 | 1 | 40 | 1 |
| Tyrrell County Schools | $16,171 | $21,844 | 2 | 52 | 0 |
| Weldon City Schools | $12,631 | $20,902 | 3 | 100 | 6 |
| Northampton County Schools | $12,662 | $20,818 | 4 | 62 | 2 |
| Innovative School District | $8,644 | $19,907 | 5 | 96 | 8 |
| Pamlico County Schools | $11,303 | $18,003 | 6 | 24 | 1 |
| Halifax County Schools | $10,367 | $17,931 | 7 | 75 | 6 |
| Washington County Schools | $12,197 | $17,808 | 8 | 58 | 0 |
| Jones County Schools | $12,078 | $17,779 | 9 | 35 | 0 |
| Graham County Schools | $10,788 | $17,131 | 10 | 86 | 0 |
| State Average | $7,426 | $12,345 | N/A | 115,311 | 828 |
| Mooresville City Schools | $6,775 | $11,283 | 106 | 7 | 16 |
| Harnett County Schools | $7,513 | $11,234 | 107 | 83 | 6 |
| Gaston County Schools | $7,166 | $11,200 | 108 | 46 | 9 |
| Moore County Schools | $6,857 | $11,119 | 109 | 8 | 13 |
| Pender County Schools | $7,025 | $11,037 | 110 | 44 | 3 |
| Cabarrus County Schools | $6,808 | $10,807 | 111 | 23 | 12 |
| Union County Schools | $6,523 | $10,774 | 112 | 6 | 19 |
| Davidson County Schools | $7,270 | $10,756 | 113 | 49 | 9 |
| Onslow County Schools | $6,787 | $10,719 | 114 | 31 | 18 |
| Johnston County Schools | $7,116 | $10,668 | 115 | 42 | 8 |
Sources: Statistical Profile of North Carolina and North Carolina Department of Non-Public Education
Note: Data is for the year 2021-22. Data for City Schools or Innovative School District apply to the county in which it operates.