- Overall, North Carolina teacher pay has improved despite periods of no or moderate pay increases
- North Carolina ranks 34th nationally and 2nd in the Southeast in teacher pay
- The increase in teacher benefits — specifically the rising cost of retirement benefits — is the biggest reason for the escalating costs of teacher compensation
Teacher pay. It’s the subject that won’t go away in North Carolina. For the past decade, teacher pay has been a hot topic across the state. Much of that staying power derives from a report issued annually by the National Education Association (NEA): the “Rankings & Estimates” report. The document is a compilation of annual survey data on education topics from state education departments.
Without a doubt, the most reported items from the report are the annual teacher salary figures and the ranking of states. Those are far from perfect statistics. For example, NEA’s average teacher pay comparisons do not account for variation in the cost of living nor include the cost of benefits. Terry Stoops, my colleague at the Center for Effective Education, has taken to correcting the problem himself by adjusting for cost-of-living differences across the nation. Detailed criticism of the NEA teacher pay calculations can be found here and here. Nevertheless, for good or ill, the average teacher pay statistic is widely reported and largely drives the debate on teacher pay in North Carolina.
The NEA reports provide a snapshot in time. They say little, however, about important components of teacher pay. They say little about how pay and rankings have changed over time. As previously stated, the NEA report fails to include either cost of living or benefits in its calculations. Nor do the calculations readily provide any specific information about how North Carolina compensates teachers relative to the states it largely competes with for education talent.
The Appendix at the end of this article has been compiled to help respond to those questions. Teacher pay and rankings data come from the annual NEA “Rankings & Estimates” reports. Rankings for Southeastern states, as well as the cost of benefits come from the North Carolina Department of Public Instruction’s “Highlights of the North Carolina Public School Budget” reports for specific years.1 The author furnished the calculations.
What does the last decade teach us about teacher pay in North Carolina?
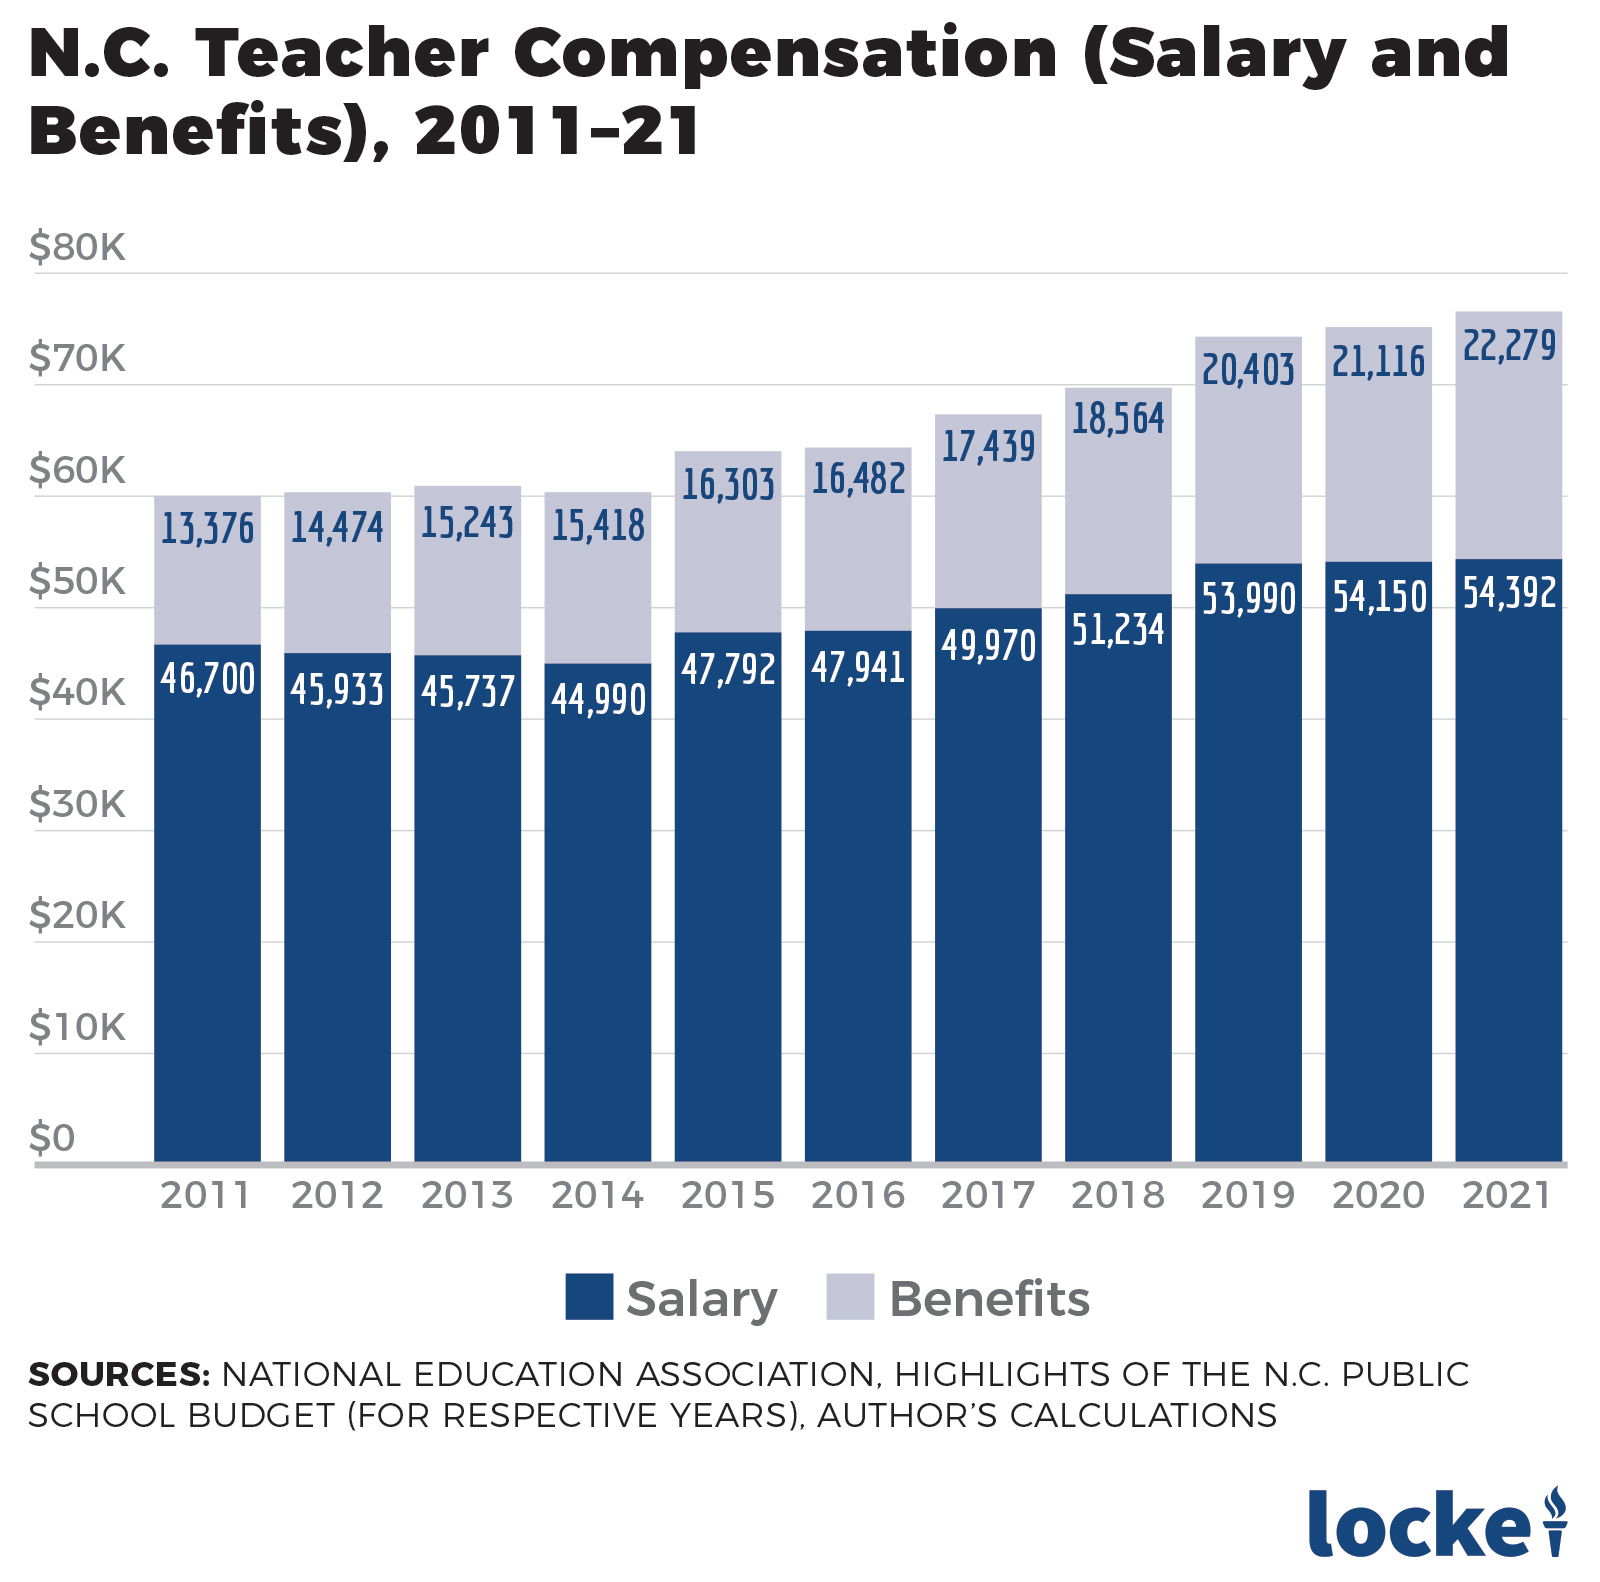
An analysis of the data in the Appendix at the end of this article yields the following graphic. The columns reflect the increase in teacher pay — until about two years ago — as well as the growing cost of benefits. Over the last decade, teacher compensation has increased from $60,076 (2011) to $76,671 (2021), a fact which frequently gets left out of the discussion on teacher pay.
Other notable highlights from the Appendix data include:
Average Salary. Since 2011, the average teacher salary in North Carolina increased 16.4%. That’s an annual average salary increase of 1.4%. Teachers received pay raises in eight of the 11 years the data were collected. Raises ranged from minor step increases — about 1.2% — to 7%. During the period, teacher compensation increased an average of 2.47% annually.
Flattening Salaries. After healthy increases from 2015 to 2019, average teacher salaries have plateaued, largely a result of the decision by Gov. Roy Cooper and legislative Democrats to veto pay raises approved by Republicans.
Gaining Ground. Since 2011, total compensation for teachers in North Carolina has increased 27.2%. During that time, inflation as measured by the Consumer Price Index went up 19.7%.
U.S. Rankings. The table in the Appendix tells us that since 2011, North Carolina has improved seven spots overall in average teacher pay rankings, climbing from 41st (2011) to 34th (2021). Early on, North Carolina fell as low as 47th in the rankings (2013 and 2014) before climbing as high at 31st in 2019, then slipped three spots in the last two years to 34th. Across the decade, North Carolina’s average ranking for teacher pay was 39th.
SE Rankings. Over the last decade, North Carolina’s ranking among the 12 Southeastern states has improved markedly. Ranking for average teacher pay improved from 7th to 2nd in the Southeast. Those improvements were also not a straight line, however. North Carolina fell to 10th in 2013 and then 11th in 2014 and 2015. Since 2016, North Carolina’s Southeast ranking has either improved or stayed the same. Despite no appreciable pay increases the last two years, North Carolina has maintained its 2nd place ranking among the 12 Southeastern states. Across the decade, North Carolina’s average ranking in the Southeast was 7th.
Benefits. The rising cost of benefits — specifically hospitalization and retirement benefits — continues to add to the costs state and local governments must pay when they employ teachers. Since 2011, the cost of hospitalization insurance has increased from $4,929 per employee to $6,326 per employee, an increase of 28%.
Retirement Benefits. While the costs of hospitalization increased moderately, that was not the case for retirement benefits. In 2011 the state share of retirement benefits per employee was 10.51% of the employee’s salary. By 2021, that percentage had more than doubled to 21.68%. In dollar terms, it means that in 2011 the state was paying about $4,908 per employee for retirement. By 2021 retirement costs had skyrocketed to $11,792 per employee.
Social Security. Employer costs for Social Security remain fixed at 7.65% of salary or wages. While the percent may remain constant, the increase in wages raised the state contribution.
Benefits and Teacher Salary. Since 2011, the average cost of benefits — health insurance, retirement benefits, and Social Security — has increased from $13,376 in 2011 to $22,279 today, an increase of 66%.
Over the past decade the cost of benefits as a percentage of average teacher salary has increased dramatically, from 28.70% to 40.96%.
The rising cost of benefits has increased the value of total teacher compensation (pay and benefits) from $59,997 to 2011 to $76,671 in 2021.
Stemming the escalating cost of teacher benefits is one of the ways policymakers can find additional money to finance teacher pay raises.
Summary
How has teacher pay changed over the last decade in North Carolina? An analysis of NEA salary rankings finds average teacher pay in North Carolina is $54,392 and has increased by 16.4% since 2011. Significant increases from 2015 to 2019 were bookended by no pay raises in three of the first four years of the decade and only step increases for teachers in the last two years, thanks to Cooper’s vetoes of Republican teacher pay increases. Even despite the moderating effects of the no-raise and veto years, teacher pay raises over the past decade improved North Carolina’s average teacher pay rankings to 34th nationally and 2nd in the Southeast.
Regrettably, NEA average teacher salaries do not include the cost of benefits. The failure to do so distorts teacher pay and masks the state’s need to manage the rising cost of teacher benefits. When state policymakers can better control the escalating cost of teacher benefits, they can secure the wise use of resources and return more compensation to teachers in the form of salary.
Appendix: Teacher Pay and Benefits in North Carolina, 2011–21
| 2011 | 2012 | 2013 | 2014 | 2015 | 2016 | 2017 | 2018 | 2019 | 2020 | 2021 | |
| Teacher Pay | |||||||||||
| Teacher Salary | $46,700 | $45,933 | $45,737 | $44,990 | $47792 | $47,941 | $49,970 | $51,234 | $53,990 | $54,150 | $54,392 |
| Pay Raise | 0.00% | 0.00% | 1.20% | 0.00% | 7.00% | 2.10% | 4.70% | 3.30% | 6.50% | 1.20% | 1.20% |
| Rankings | |||||||||||
| National | 41 | 46 | 47 | 47 | 42 | 41 | 38 | 33 | 31 | 33 | 34 |
| Southeastern States | 7 | 7 | 10 | 11 | 11 | 10 | 9 | 5 | 4 | 2 | 2 |
| Benefits | |||||||||||
| Hospitalization Insurance | $4,929 | $4,931 | $5,192 | $5,285 | $5,378 | $5,471 | $5,471 | $5,869 | $6,104 | $6,306 | $6,326 |
| Retirement | 10.51% | 13.12% | 14.23% | 14.69% | 15.21% | 15.32% | 16.12% | 17.13% | 18.86% | 19.70% | 21.68% |
| Social Security | 7.65% | 7.65% | 7.65% | 7.65% | 7.65% | 7.65% | 7.65% | 7.65% | 7.65% | 7.65% | 7.65% |
| Total Benefits 2 | $13,376 | $14,474 | $15,243 | $15,418 | $16,303 | $16,482 | $17,439 | $18,564 | $20,403 | $21,116 | $22,279 |
| Benefits as a Percent of Average Salary | 28.70% | 31.50% | 33.18% | 33.99% | 34.11% | 34.37% | 34.89% | 36.23% | 37.82% | 38.99% | 40.96% |
| Total Compensation3 | $59.997 | $60,421 | $61,181 | $60,773 | $64,095 | $64,423 | $67,409 | $69,978 | $74,343 | $75,266 | $76,671 |
Notes
1 NEA rankings in the “Rankings & Estimates” reports and DPI rankings in the “Highlights of the North Carolina Public School Budget” reports may not match. NEA revises estimates and frequently will change a state’s ranking based on revised or updated information. Southeast rankings are from the DPI’s “Highlights of the North Carolina Public School Budget” reports. The author acknowledges that these data represent a snapshot in time and that changes often occur, which change a state’s relative ranking.
2 Total benefits = Ave. Teacher Pay x % Hospitalization Cost + Ave. Teacher Pay x % Retirement Cost + Social Security x Ave. Teacher Pay.
3 Total Teacher Compensation = Teacher Salary + Teacher Benefits.