This review of “Sound Basic Education for All: An Action Plan for North Carolina” by California-based consultant WestEd will focus on student performance. “Sound Basic Education for All” offers an incomplete and somewhat misleading account of North Carolina’s performance on the rigorous National Assessment of Educational Progress (NAEP) reading and math tests.
NAEP reading and math tests are administered to a representative sample of fourth- and eighth-grade students in each state in odd-numbered years (since 2003). Many consider NAEP, also called “The Nation’s Report Card,” to be the gold standard of standardized testing. Because North Carolina’s end-of-grade and end-of-course tests have been subject to multiple changes in recent years, NAEP tests are the best way to track student performance over time.
Review of student achievement in North Carolina
WestEd researchers correctly point out that between 1992 and 2003, North Carolina public school students exhibited substantial test score growth in math. Without a doubt, pre-Leandro measures of student performance are useful, but I believe that the Leandro I decision in 1997 should be the starting point in an examination of test scores. Because NAEP tests are not administered annually, this means starting with NAEP reading scores in 1998 and math scores in 2000. Unlike WestEd, I note statistical significance (alpha levels for all tests = 0.05) as calculated by the NAEP Data Explorer.
Fourth-Grade Reading
In their discussion of North Carolina’s performance on NAEP reading tests, WestEd researchers observe,
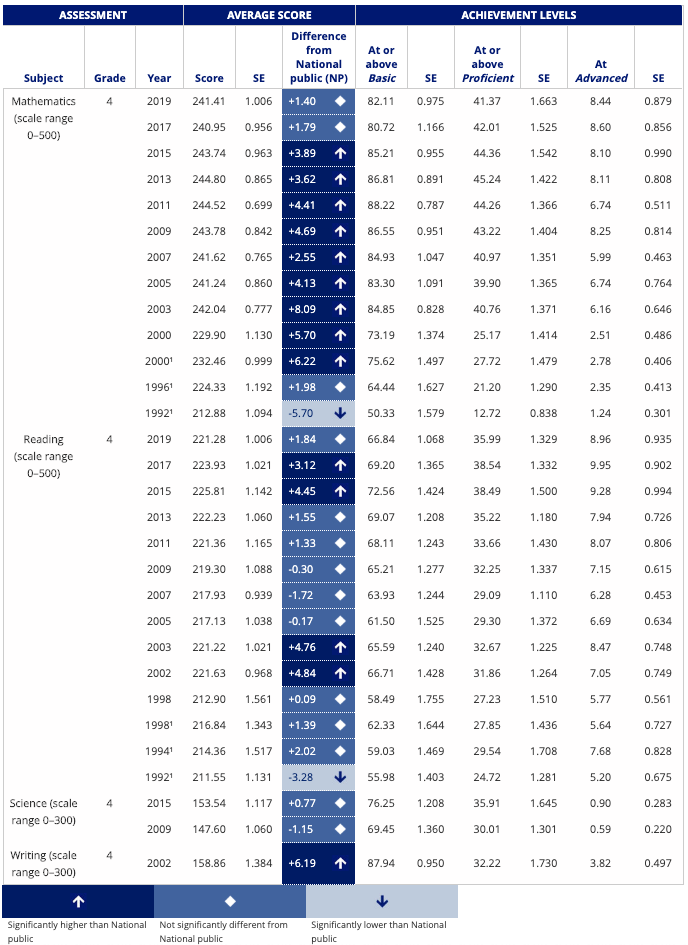
The NAEP reading data are shown starting in 1998, the year in which the reading assessment was first administered in grade 8. The reading results show some progress for grade 4, with the average score increasing from 213 in 1998 to 221 in 2003, an increase of 8 points in five years. As in mathematics, the increase took North Carolina from below to above the national average. However, the increase in grade 4 reading scores did not continue, as the average score increased by only 3 points in the 14 years from 2003 to 2017. (p. 24-25)
During the Leandro period (from 1998 to 2019), NAEP average scale score for reading among fourth-grade North Carolina students increased by 8 points, a statistically significant increase. Indeed, increases between 1998 and 2000, 2003, 2005, 2007, 2009, 2011, 2013, 2015, 2017, and 2019 test administrations were also statistically significant. While it is true that fourth-grade reading scores stagnated somewhat starting in 2002, average scores peaked in 2015 (with a statistically significant 4 point increase between 2002 and 2015) only to drop again in 2019 (with a statistically significant 5 point decrease between 2015 and 2019). WestEd fails to acknowledge the 2015 score in the text of the report, even though it is represented clearly in graphs.
(Note: One of the companion reports, “Educator Supply, Demand, and Quality in North Carolina: Current Status and Recommendations,” states, “Declines in achievement have occurred since 2013 in mathematics and reading on the National Assessment of Educational Progress (NAEP),” but this is not true for the 2015 fourth-grade reading score.)
Disadvantaged students who were eligible for participation in the National School Lunch Program increased their average scale score by only 2 points between 2003 and 2019, which was not a statistically significant change. Nevertheless, fourth-grade reading average scale scores increased by a statistically significant 10 points during the Leandro period (from 1998 to 2019). Moreover, the 2015 average scale score remains the highest score for the National School Lunch Program-eligible population.
Table 1. North Carolina Statewide NAEP Results: Fourth Grade
Eighth-Grade Reading
For decades, North Carolina students have struggled on the eighth-grade NAEP reading test. WestEd writes,
The grade 8 reading data show no substantial gains from 1998 through 2017, with the score going up and down over only a 7-point range, from 258 to 265, across the 10 exams, with the 2017 score being 1 point higher than the 1998 score. As a result, North Carolina fell slightly behind the national average over these years. (p. 24-25)
During the Leandro period, the scale score for eighth-grade students increased by only 1 point, which was not statistically significant. The average eighth-grade reading score for the National School Lunch Program eligible students was not statistically significant between 1998 and 2019. Average scale scores spiked in 2013 and produced statistically significant gains for both populations before dropping in subsequent years.
WestEd does not attempt to explain the different trajectories of the fourth- and eighth-grade scores, nor do their recommendations reflect these differences.
Fourth-Grade Math
Between 1992 and 2003, North Carolina’s math scores soared. WestEd researchers write,
In mathematics, the 1992 to 2003 data for both grades show steady increases for North Carolina students — 28 points at grade 4 and 24 points at grade 8. As a result, North Carolina students at both grades advanced from below to above the national average in NAEP mathematics scores during this time period. However, the gains did not continue past 2003, with the average scores at both grades 4 and 8 on the 2017 assessments being within 1 point of the 2003 results, placing North Carolina students within 1 point of the national average in mathematics at each grade. (p. 24)
During the Leandro period (from 2000 to 2019), the average scale score for mathematics among fourth-grade North Carolina students increased by 12 points (due to rounding), a statistically significant increase. Fourth-grade students eligible for the National School Lunch Program also increased their math scores by 12 points during this period, which was statistically significant. WestEd researchers largely disregard significant test scores increases in 2011 and 2013.
Table 2. North Carolina Statewide NAEP Results: Eighth Grade
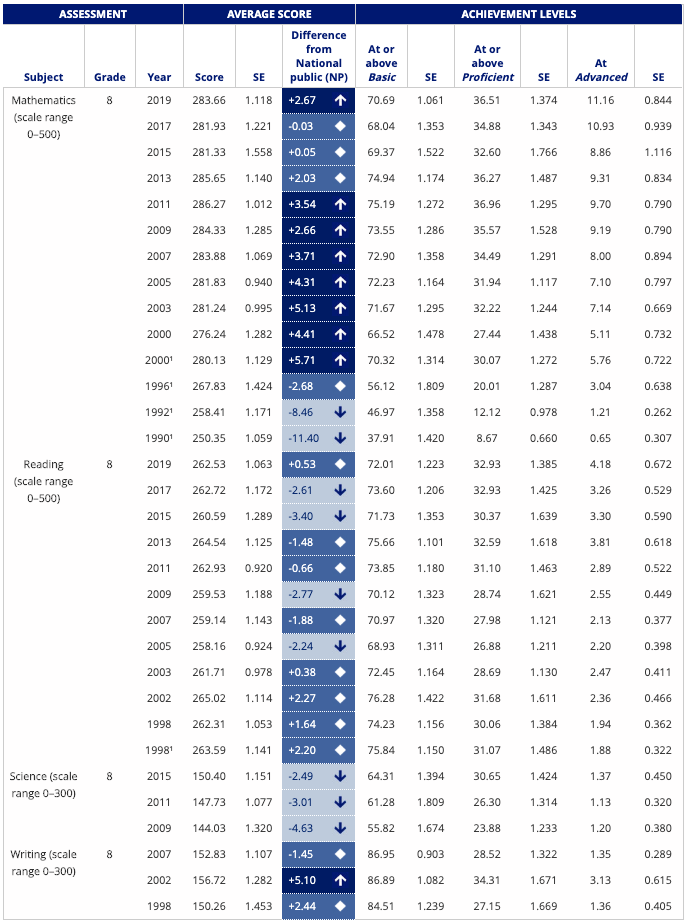
Eighth-Grade Math
Eighth-grade math scores increased by a statistically significant 7 points (due to rounding) during the Leandro period. Nevertheless, statistically significant increases for the National School Lunch Program eligible students ceased in 2005, except for a spike in average scores in 2011 and 2013.
Although WestEd did not have access to the 2019 NAEP results when they submitted their report to the courts, it is worth noting that the state’s average eighth-grade math score was significantly higher than the national average. All other 2019 scores are not significantly different than the national average. Since 1998, North Carolina’s average scale scores in math and fourth-grade reading have been at or above the national average. The exceptions were eighth-grade reading and science.
What accounted for student achievement changes in NAEP math and reading scores?
WestEd researchers speculate that “a new system of curriculum standards and assessments, strengthening the teaching profession, increasing funding for education, and implementing other initiatives…led to substantial increases in students’ achievement from the early 1990s through the mid-2000s.” (p. 11-12) Yet, WestEd researchers offer no empirical evidence that any of the reforms listed above led to achievement gains. Moreover, they fail to explain why these reforms, which continued to be implemented with fidelity by Gov. Mike Easley and his fellow Democrats in the General Assembly, failed to produce meaningful gains between 2003 and 2009.
Instead, WestEd claims that post-recession changes by Republican majorities in the General Assembly are to blame.
However, cutbacks that began during the recession after 2008, along with much deeper legislative cuts over the last few years, have eliminated or greatly reduced many of the programs that were put in place and have begun to undermine the quality and equity gains that were previously made. Declines in achievement have occurred since 2013 in mathematics and reading on the National Assessment of Educational Progress (NAEP), and achievement gaps have widened. (p. 14)
WestEd refers to “deeper legislative cuts over the last few years” in this passage, but even WestEd reports that inflation-adjusted per-pupil expenditures have increased since 2014 (see p. 177). As noted in a previous article, inflation-adjusted per-pupil spending increased during the Leandro period of 1997 to 2019.
Beyond the misrepresentation of state education spending, however, the authors imply a causal relationship between “legislative cuts” and NAEP performance. Such a relationship between spending and performance may exist, but the authors offer no empirical evidence that it does. After all, so-called “legislative cuts over the last few years” did not produce the stagnation beginning in 2002 or record high scale scores between 2011 and 2015. In fact, WestEd does not explain the test score spikes in fourth- and eighth-grade math in 2011 and 2013, fourth-grade reading in 2015, or eighth-grade reading in 2013.
North Carolina performance properly measured
But the overall performance of the state requires measures that account for its demographics. The Urban Institute’s America’s Gradebook tool adjusts NAEP scores to account for demographic differences across students in each state. Urban Institute researchers incorporate controls for age, race or ethnicity, special education status, free and reduced-price lunch eligibility, and English language learner status. When these factors are used to adjust NAEP scores, North Carolina’s academic performance is much better than the average scale scores would suggest.
America’s Gradebook suggests that the most significant deficiency in instruction occurs in middle school reading. However, the adjusted score has allowed the state to surge from 31st in the nation to 11th in the nation between 2017 and 2019. In fourth-grade reading and fourth- and eighth-grade math, North Carolina is a top-10 state and has generally remained so since 2011 despite what WestEd describes as “relatively flat” year-over-year funding.
Of course, a top-10 ranking should not satisfy state education leaders. Our goal should be to have the highest adjusted NAEP scores in the nation. To achieve that goal, state education leaders need to look beyond the WestEd report, which offers very few recommendations that focus on middle schools. The state should reassess middle school reading standards, curriculum, and instruction to determine why students in these grades appear to regress academically.
The need to understand the relationship between spending and student performance has never been more critical. While the WestEd report recommends adding billions to the state’s public schools, it is relatively silent on the ways that existing resources are used. Indeed, if our current system of public schools does not use taxpayers’ dollars in productive ways, then there is no guarantee that new dollars will be used in ways that boost student achievement.