This is the third and final Civitas Partisan Index (CPI) post for the 2022 election. One crucial question is whether Republicans will win supermajorities, allowing them to override Gov. Roy Cooper’s vetoes. Republicans must win 72 seats in the North Carolina House and 30 in the Senate to gain supermajorities.
After briefly presenting a summary of changes from the previous CPI posts, we will go over three layers of analysis: the baseline partisan tendencies of districts as indicated by the CPI, the influence of the broad political environment on those baselines, and factors that may case individual races to differ from the general expectations.
Summary of Changes
Much of this post is the same as the second CPI post in May. There are two main changes:
- Second quarter fundraising reports have been added to the “races to watch” section to help readers know which campaigns are more likely to outperform their district’s CPI rating.
- Toss-up districts have been added to the Races to Watch list to reflect the tightening of generic polling over the summer.
Part 1: Baseline Ratings of Districts in the Civitas Partisan Index
The CPI measures the base partisan leanings of a North Carolina state legislative district compared to the state as a whole. While partisan lean is just one part of the puzzle when analyzing who is likely to win in a district, someone using the CPI without any other data would have successfully predicted 90 percent of state legislative races in 2018 and over 94 percent of races in 2020. Click here to see the methodology behind the CPI.
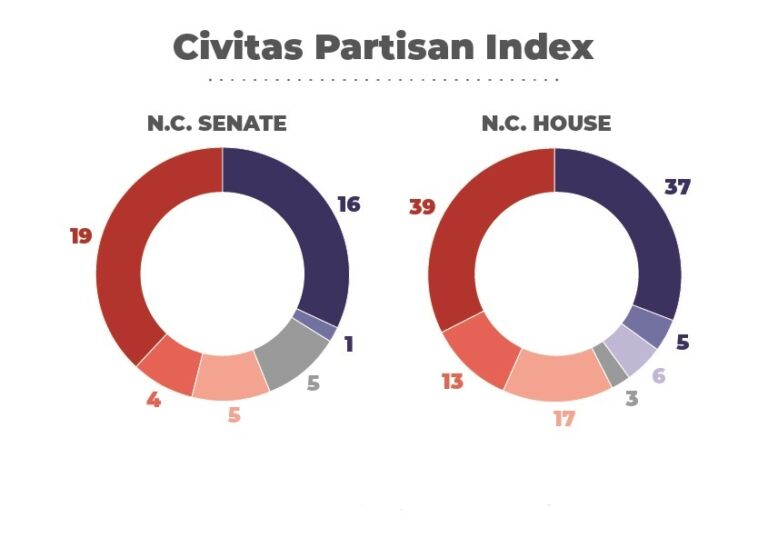
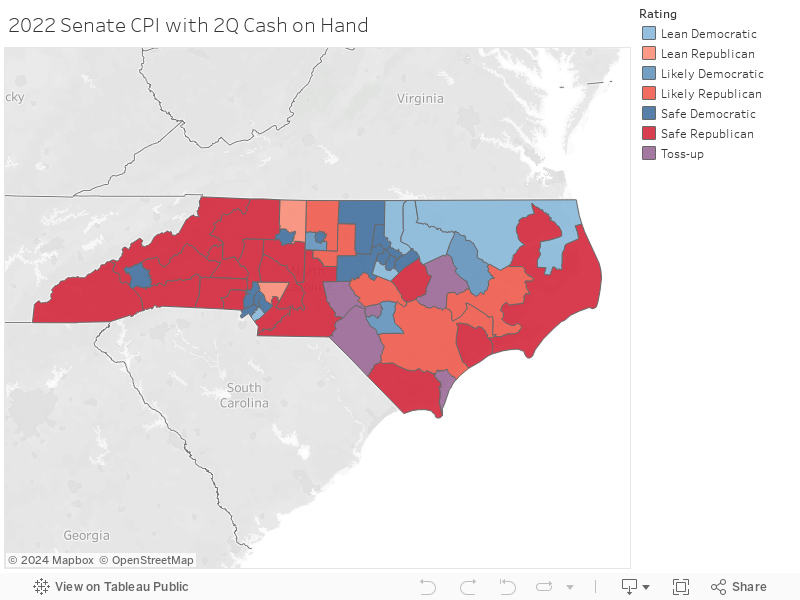
So, how does the CPI rate General Assembly districts this year? As seen in the figure below, the CPI rates 24 Senate Districts as either lean (2-5 percent advantage), likely (6-9 percent), or safe (10+ percent) Republican. On the other hand, 22 are lean, likely, or safe Democratic. That leaves 4 toss-up seats where neither party has a baseline advantage.
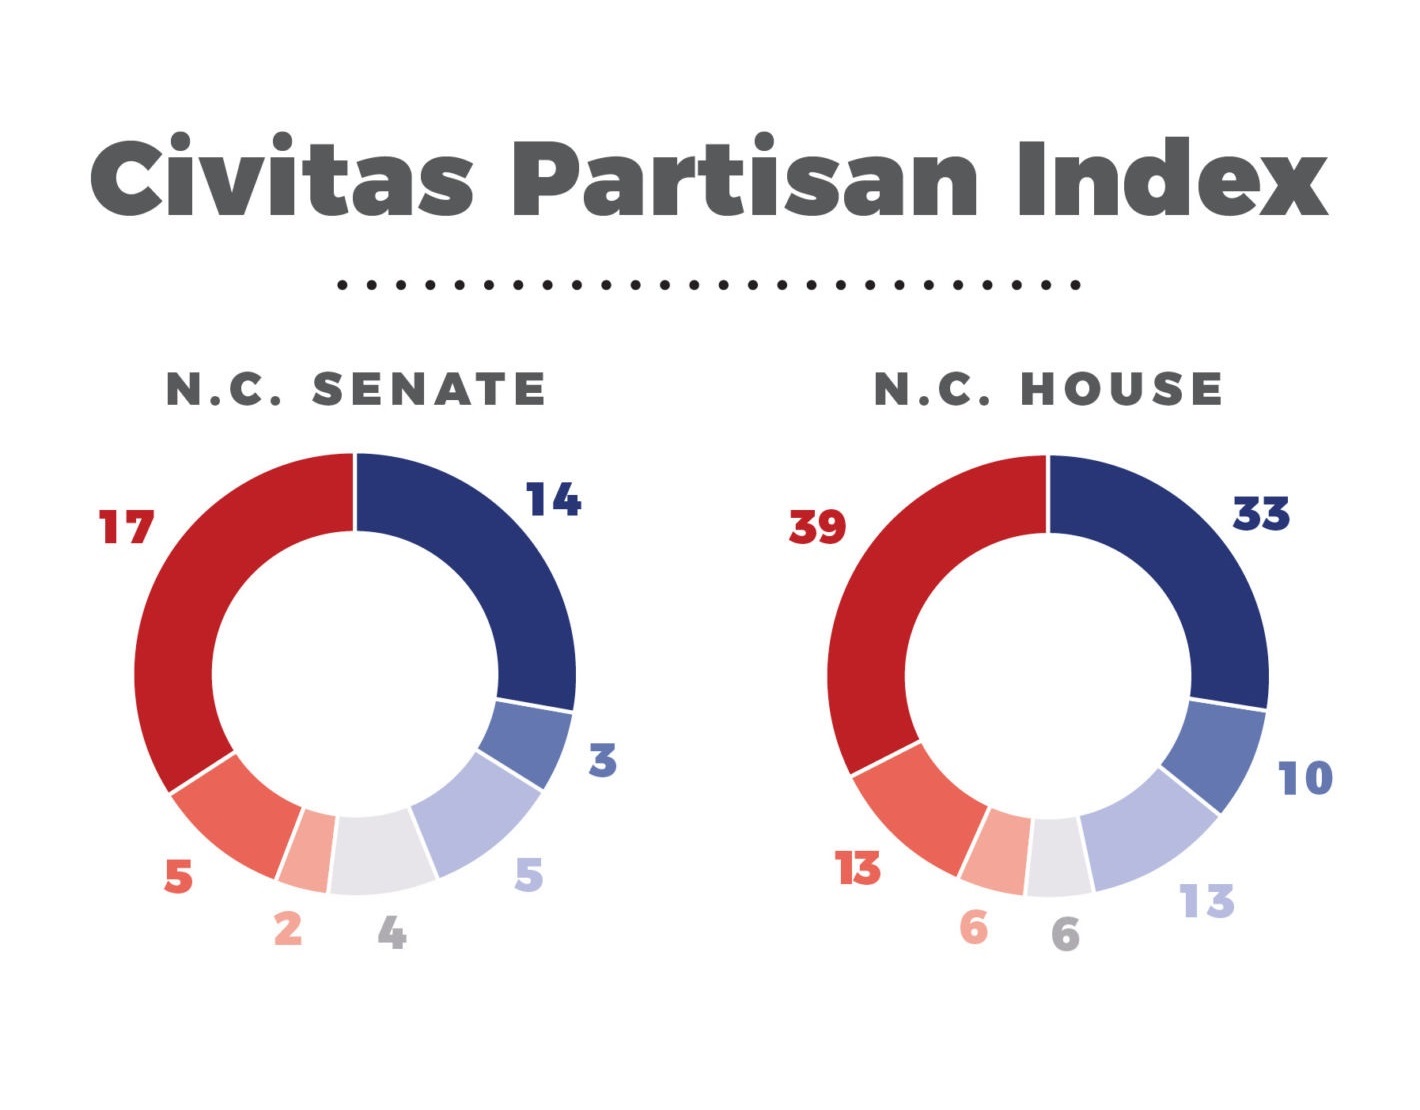
In the House, Republicans have a baseline advantage in 58 districts, compared to 56 districts with a Democratic baseline advantage and 6 toss-up seats.
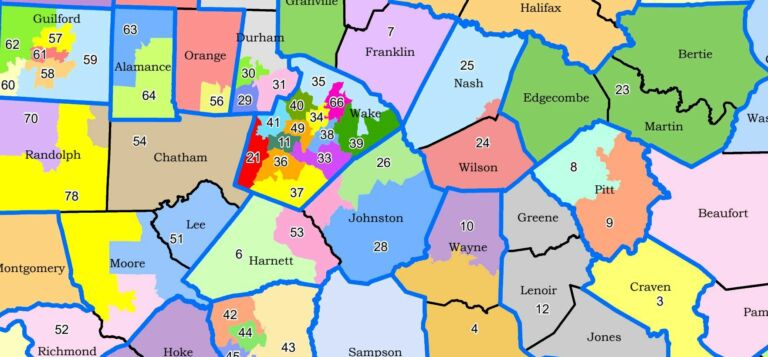
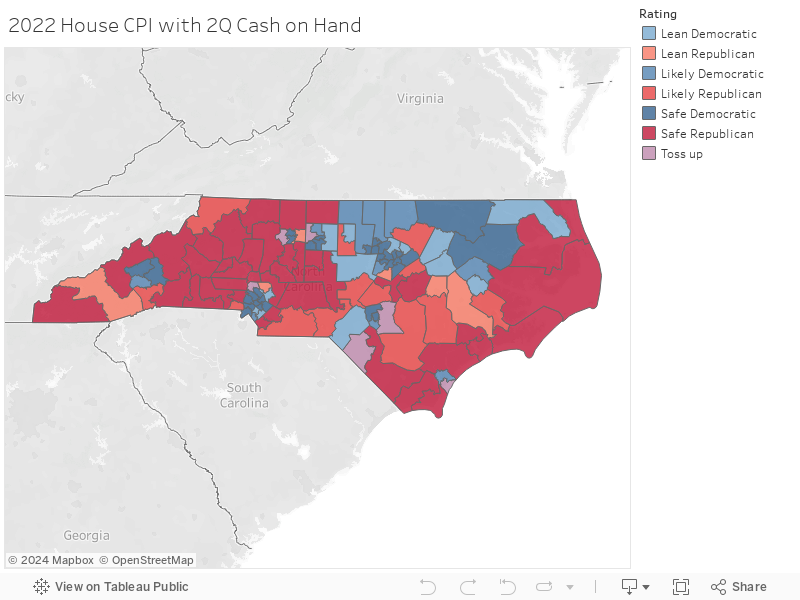
Below are district maps for the North Carolina Senate and House. Information for each district includes the CPI rating, the Republican candidate, and the Democratic candidate. Some districts only have one major-party candidate. Below the maps are Excel files for the Senate and House. (Libertarian and Green Party candidates are not included in the maps but are on the Excel files.)
Part 2: The Political Environment
The president’s party usually suffers losses in midterm elections. While that is likely the case this year, Democrats have been bolstered by polling over the summer showing that they have closed some of the gap with Republicans. An 11.4-point Republican lead over Democrats in the generic state legislature ballot question in June narrowed to just 5 points in August. North Carolina is an R+1 state, so a Republican advantage of five percentage points means that many districts that are rated D+4 are the real “toss-ups.”
In this environment, the districts rated “toss-up” or “lean Democratic” in the CPI are the most likely to be competitive.
Part 3: Individual Campaigns and Candidates
Political Science research has found that campaigns cannot alter fundamentals but can affect outcomes on the margins. So, a well-run campaign with a strong candidate might be able to get a few percentage points higher than the district’s baseline, and the political environment, would indicate.
The “races to watch” tables below include two indicators of candidate quality. The first is incumbency. While some incumbents are running in very different districts due to redistricting, they all have campaign experience and have developed connections with voters that can help them win. The second is money; specifically, the second quarter cash-on-hand reported to the North Carolina State Board of Elections in July. While the relationship between money and winning elections is more complicated than most people appreciate, it exists.
Races to Watch on November 8
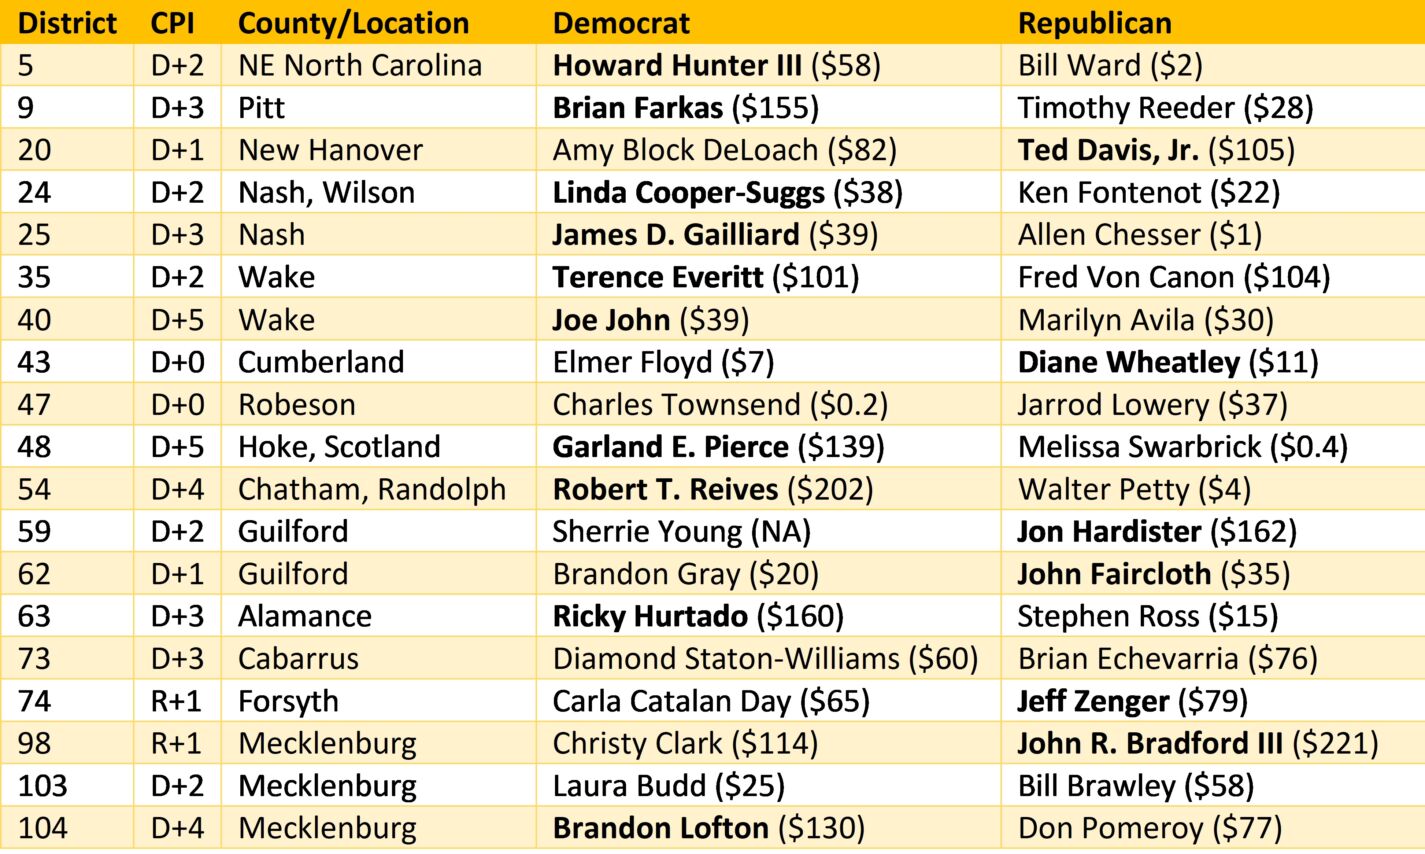
With all that in mind, here are the seats that will most likely determine control of the General Assembly. In both tables, incumbents are in bold and second-quarter cash-on-hand, in thousands, is in parentheses.
In the House, Republicans must win in 14 of the 19 “toss-up” and “lean Democratic” districts in Table 1 to win a supermajority. Democrats must win 18 of them to get a simple majority.
Table 1: “Toss-up” and “lean Democratic” districts in the NC House
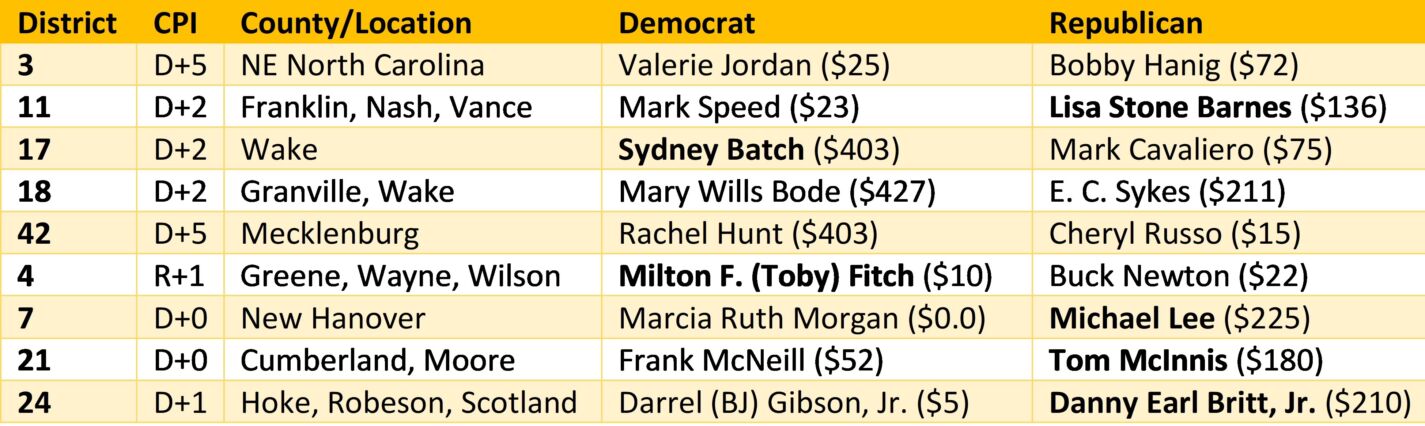
In the Senate, Republicans must win 6 of the 9 seats in Table 2 to win a supermajority. Democrats must win all 9 to gain a simple majority.
Table 2: “Toss-up” and “lean Democratic” districts in the NC Senate
Of course, there could also be a few surprises on November 8. In 2018, Republicans carried three lean-Democratic districts in an otherwise good year for Democrats. On the other hand, Democrats picked up one “likely Republican” district that year.
Nevertheless, the 28 districts featured here will likely determine the balance of power in Raleigh.