North Carolina Gov. Roy Cooper has recently made the national media rounds claiming that the current General Assembly is a partisan gerrymander. Does this claim have any merit? The short answer is not at all.
The original 2022 maps for state House, Senate, and Congressional maps were challenged under both racial and partisan gerrymandering claims. While a trial court dismissed the racial gerrymandering claims, the state Supreme Court tossed the three maps under a new partisan gerrymandering standard they created. The court then ordered the state legislature to redraw all maps, giving them vague standards to follow. The trial court then appointed three special masters to review the maps submitted by the General Assembly and plaintiffs in the case.
House Map
The argument that the remedial House map is a Republican-advantaged gerrymander is the most nonsensical of the claims. The redrawn House map was passed by the vast majority of Democrats in both Chambers, passing 115-5 in the House and 41-3 in the Senate. Of the Seven amendments presented by Democrats, six of them were passed and enrolled into the maps.
The three-judge panel, under the advisement of the court-appointed special masters and the 4-3 Democratic majority supreme court, found in favor of these redrawn House maps. Even in Gov. Cooper and Attorney General Josh Stein’s Amicus brief in the case did not question the redrawn House maps.
There is nothing to support the claim that the House maps is a partisan gerrymander in favor of Republicans, but it does have a problem.
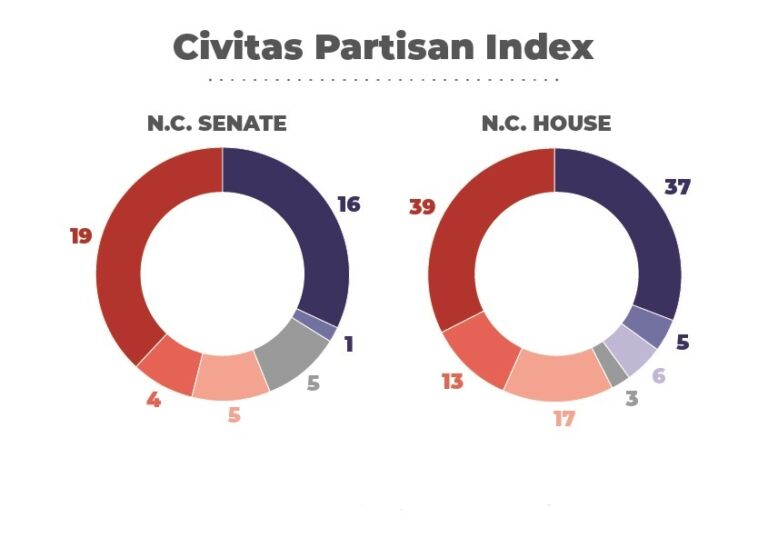
The remedial House map is 63-57, as measured by the Civitas Partisan Index (CPI) and Dave’s Redistricting. While their methodology differs (the CPI utilizes the 2020 Council of State elections, and Dave’s uses a composite of 2016 & 2020 statewide election data), their top-line results are the same.
The House map used in the 2022 election does fall outside the normal range of expected political leanings, but it does not favor Republicans. The bias of this map is on the opposite end of the spectrum. As seen in Figure 1, the plaintiff’s expert witness, Dr. Daniel Magleby, found that the most likely outcome for a House map not drawn under politically neutral criteria is for Democrats to be favored in between 51 and 53 districts out of 120. None of the 1,000 maps Magleby’s computer system produced had 57 Democratic-leaning districts.
Figure 1: Graph from plaintiff’s expert witness Dr. Daniel Magleby indicating the likelihood of partisan makeup of North Carolina House Districts. Graphic source: Page 12 of Magleby’s written Testimony in North Carolina League of Conservation Voters v. Hall.
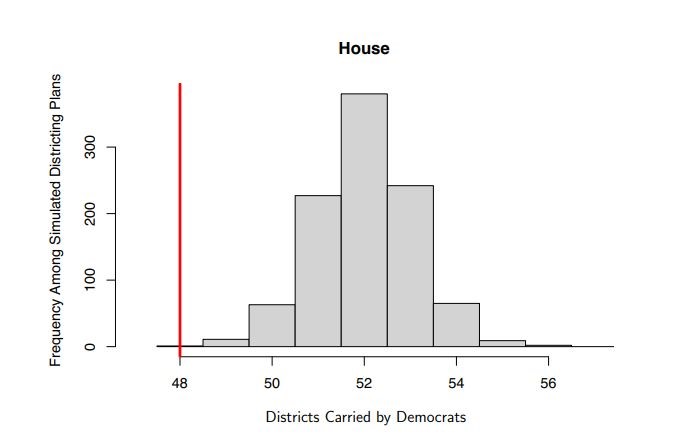
The 1,000 maps were created from a composite data set of North Carolina’s 2016 and 2020 elections and considered the redistricting requirements created under the Stephenson criteria.
Senate Maps:
The Senate map was received with more opposition from Democrats in the state legislature than its House counterpart. The Senate followed the court’s findings regarding mean-median scores, efficiency gap, and the partisan composition of the maps when redrawing the map.
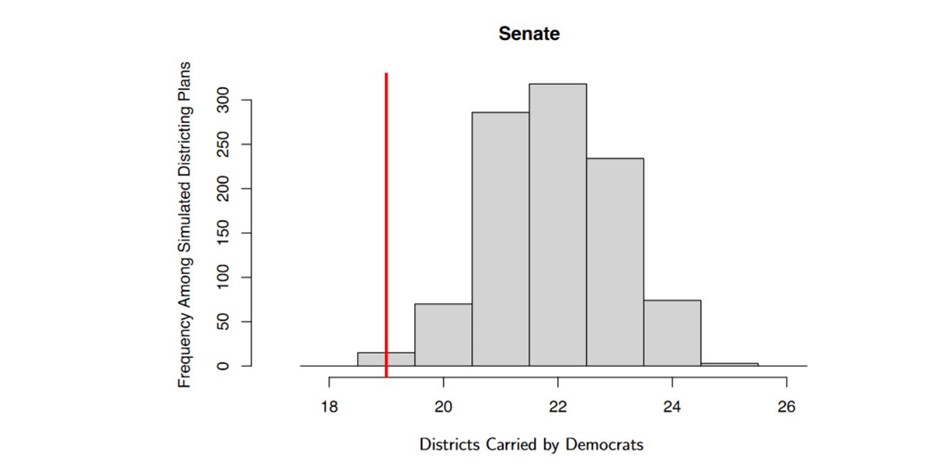
Magleby found the most likely outcome of a Senate map drawn using politically neutral criteria was between 21-23 seats out of 50 favoring Democrats. The CPI and Dave’s ratings both found that the Senate map used in 2022 had a 28-22 Republican advantage. This is the most likely partisan makeup for a Senate map, according to Dr. Magleby (see Figure 2).
Figure 2: Graph from plaintiff’s expert witness Dr. Daniel Magleby indicating the likelihood of partisan makeup of North Carolina Senate Districts. Graphic source: Page 17 of Magleby’s written Testimony in North Carolina League of Conservation Voters v. Hall.
The Senate map aligned with the efficiency gap requirements set by the court and Median-mean calculations. The court established a plus or minus 7% efficiency gap under Common Cause v. Lewis. The Senate map met this requirement with an efficiency gap of -4.24%. The median-mean calculations for the redrawn map came in at -0.008, well within the court’s requirements of plus or minus 1% and the most likely outcome in Magleby’s findings.
Figure 3: Graph of range of median-mean difference scores of North Carolina Senate maps from Dr. Daniel Magleby page 19 with remedial map data superimposed.
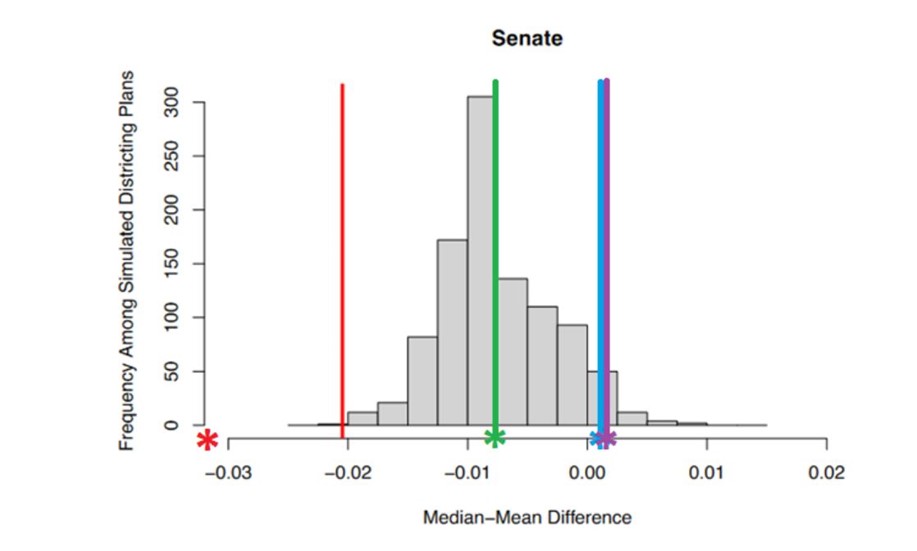
Like the House map, the remedial Senate map was approved by the Three Judge panel and the special masters. Unlike the House map, it was rejected by the Democratic majority on the state supreme court. The supreme court’s findings were inconsistent with the data presented in the trial court. The Senate map faired far better than the House map on efficiency gap, partisan composition, and median-mean difference.
Figure 4: Graph range of median-mean difference scores of North Carolina House maps from Dr. Daniel Magleby page 14 with remedial map data superimposed.
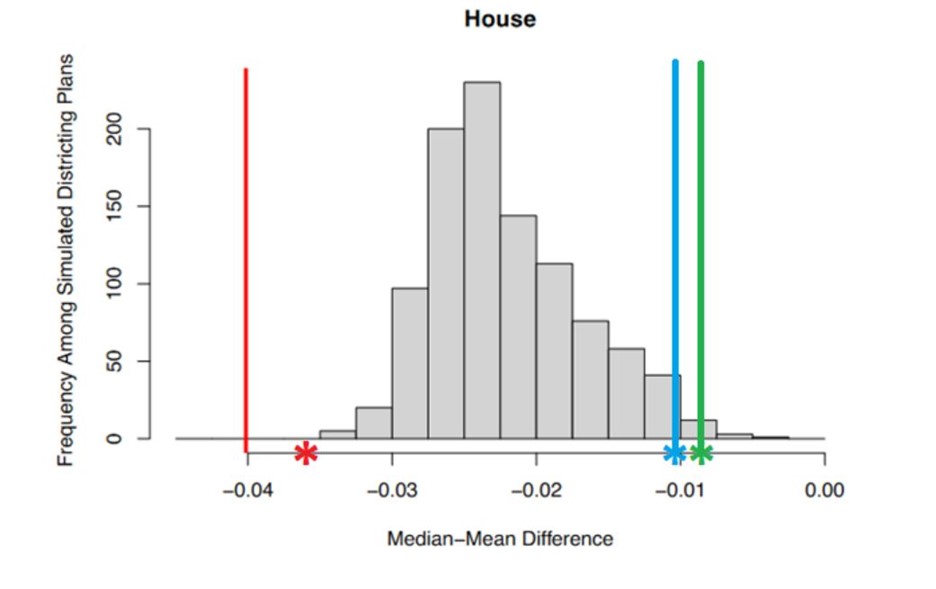
As shown in Figure 4, the House map is far outside the normal range of median-mean difference in Magleby’s set of House maps.
Cooper and his allies have attempted to warp the term gerrymandering into anything unfavorable to Democrats. Gerrymandering is creating maps to your advantage. The Senate maps follow the most likely outcome of elections. Arguably the only gerrymander in the state favors Democrats in the House, as it does not align with what we would expect from maps drawn using politically neutral criteria.