- A pair of Duke mathematicians analyzed 100,000 possible legislative redistricting maps using nonpartisan redistricting standards
- They found that Republicans had an advantage in North Carolina districts drawn using nonpartisan criteria
- Republicans have a similar advantage in North Carolina Senate maps drawn using nonpartisan criteria
During the debate over redistricting in North Carolina, we have seen competing versions of what “fair maps” would look like. So, what would be the outcome if legislators ignored partisanship and drew maps strictly on nonpartisan redistricting criteria?
New research helps answer that question.
Quantifying legislative districts
Two Duke University researchers, assistant research professor of mathematics Gregory Herschlag and mathematics professor Jonathan C. Mattingly, used an algorithm to create an ensemble of 100,000 possible North Carolina House maps and 100,000 possible North Carolina Senate maps using the following nonpartisan criteria:
- Follow the county grouping process mandated by Stephenson v. Bartlett
- Minimize splitting counties
- Keep all districts contiguous
- Keep all districts within 5% of ideal populations (except in Wake County)
- Do not split precincts (except in Craven and Wake counties)
- Make districts compact within a reasonable standard
(They reported that the exceptions for Wake and Craven counties had a negligible effect on the outcome of the study.)
All those standards are either required by the North Carolina State Constitution or included in the criteria adopted by the joint North Carolina General Assembly redistricting committees (although legislators may split precincts some). The researchers’ criteria also excluded partisan and racial data, as do the General Assembly’s.
The General Assembly’s criteria include trying to keep municipalities whole. Herschlag and Mattingly created an ensemble of maps that similarly avoids fragmenting municipalities and another one that does not. In this article I will report the results of the group of maps that ignores municipal borders (which is more advantageous for Democrats).
Distribution of Nonpartisan North Carolina House Election Results Show Republican Advantage
Once the researchers made 100,000 district maps, they used data from all statewide elections in 2008, 2012, 2016, and 2020 to compute the results of North Carolina House races.
To help visualize the results, they created graphs showing the distribution of legislative race outcomes based on a representative sample of elections (see Figure 1). Each graph is said to measure the likely number of Democrats elected to the North Carolina House of Representatives based on the votes the Democratic candidate received in that statewide election. The highest point on the distribution of legislative race outcomes is taken to be the most likely outcome based on that race. (The abbreviations used in the graphs for the different statewide elections are AG for Attorney General, USS for United States Senate, CI for Commissioner of Insurance, LG for Lieutenant Governor, GV for Governor, TR for State Treasurer, SST for Secretary of State, AD for State Auditor, CA for Commissioner of Agriculture, and PR for United States President, followed by two digits representing the election year.)
For example, look at the 2020 presidential race (PR20, in which Democratic candidate Joe Biden got 49.36% of the two-party vote). According to their estimates based on this race, the most likely outcome for North Carolina House races using maps drawn by nonpartisan criteria (which here included splitting municipalities, more favorable to Democrats) would be for Democrats to win 57 of 120 seats.
As seen in Figure 1, even when Democrats win small majorities in statewide races, Republicans would likely retain majorities in the NC House in most elections using nonpartisan maps. The most likely result estimated from the returns from the 2012 Commissioner of Insurance race (CI12, in which the Democratic candidate got 51.82% of the two-party vote) would be for Republicans to win a 61-59 seat majority in the House, with a range of expected seats going from a 64-56 Republican majority to a 61-59 Democratic majority.
The issue is not just how many votes each party gets but where those votes are. Democrats tend to be clustered in urban areas while Republicans are more evenly distributed across the state, giving them more opportunities to form local election majorities.
Figure 1: Possible number of Democratic seats won in the North Carolina House based on the distribution of votes in several elections in an ensemble of 100,000 district maps when municipal boundaries are ignored
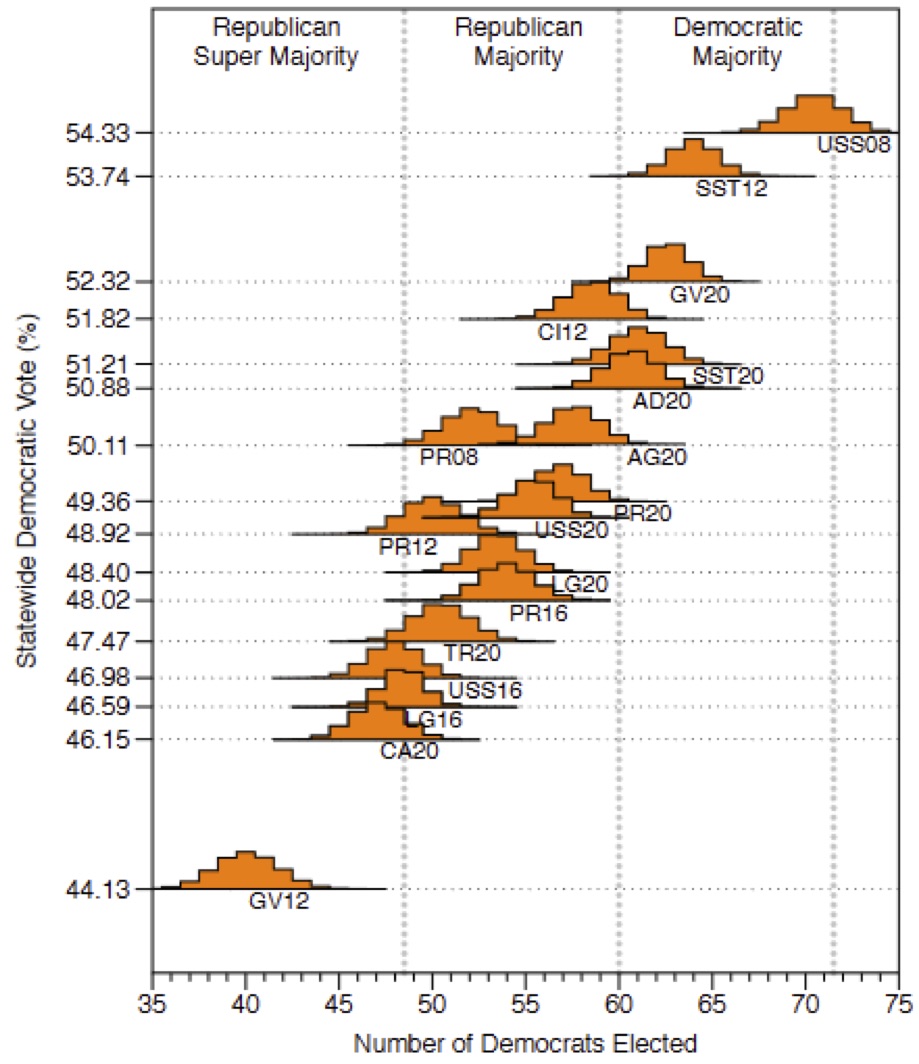
Source: Herschlag and Mattingly NC House study
Distribution of Nonpartisan North Carolina Senate Election Results Tell a Similar Story
Herschlag and Mattingly also examined North Carolina Senate seat distributions. Figure 2 depicts the likely distribution of North Carolina Senate seats across several elections on an ensemble of 100,000 maps drawn with nonpartisan criteria.
Figure 2: Possible number of Democratic seats won in the North Carolina Senate based on the distribution of votes in several elections in an ensemble of 100,000 district maps when municipal boundaries are ignored
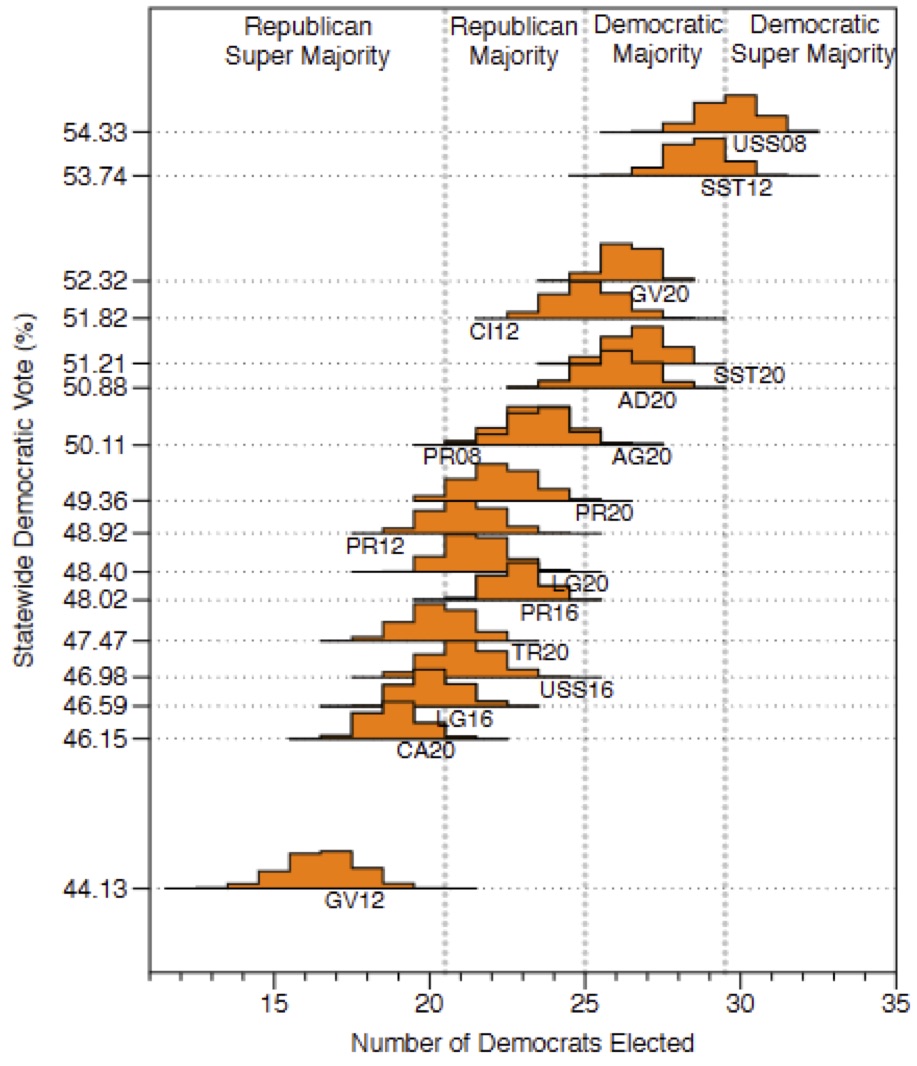
Source: Herschlag and Mattingly NC Senate study
Remember that these results are based on maps that readily cracked municipalities, which would aid Democrats. Map ensembles that respected municipal boundaries had an even stronger Republican advantage.
Another thing to keep in mind is that North Carolina is not a 50-50 state as is sometimes said, but closer to a 51-49 Republican state, meaning that Republicans would be on the cusp of supermajorities in a typical election using maps drawn with nonpartisan criteria.
Of course, such district algorithms cannot fully explain nonpartisan factors that influence variation in election outcomes, as they do not account for factors such as incumbency, candidate quality, and local issues.
But the data presented by Herschlag and Mattingly can help explain part of that variation. The partisan distribution of voters across North Carolina, with Democrats concentrated in a few areas and Republicans more evenly distributed across the state, accounts for much of the Republican advantage in General Assembly seats. In maps drawn using nonpartisan criteria it is geography, not gerrymandering, that advantages Republicans.