In my previous research brief, I noted how the General Assembly could use the findings of the plaintiffs’ expert witnesses to help them draw districts in compliance with the North Carolina Supreme Court’s February 4 ruling in North Carolina League of Conservation Voters v. Hall.
In this post, I will go over what the plaintiffs’ witnesses wrote about North Carolina State Senate districts in their written testimony. Specifically, I will use the written testimony of Dr. Daneil Magleby.
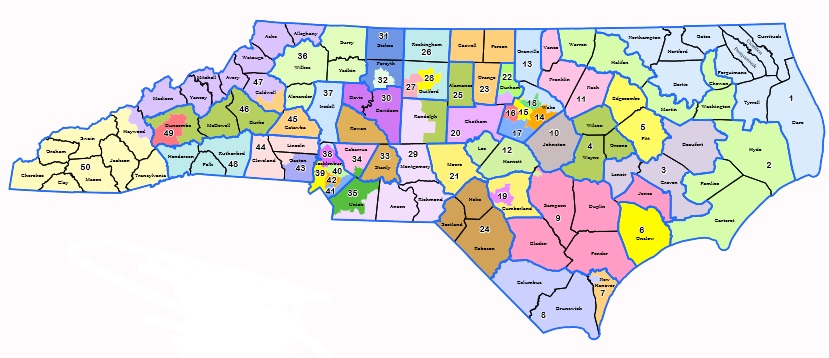
Magleby wrote that he created an ensemble of randomly generated maps following neutral redistricting criteria within North Carolina’s county clusters. According to his analysis, the redistricting plan enacted by the General Assembly (Figure 1) is 31-19 Republican (the Civitas Partisan Index rated it 28-22 Republican).
Figure 1: North Carolina Senate map enacted by the General Assembly in 2021. Source: North Carolina General Assembly
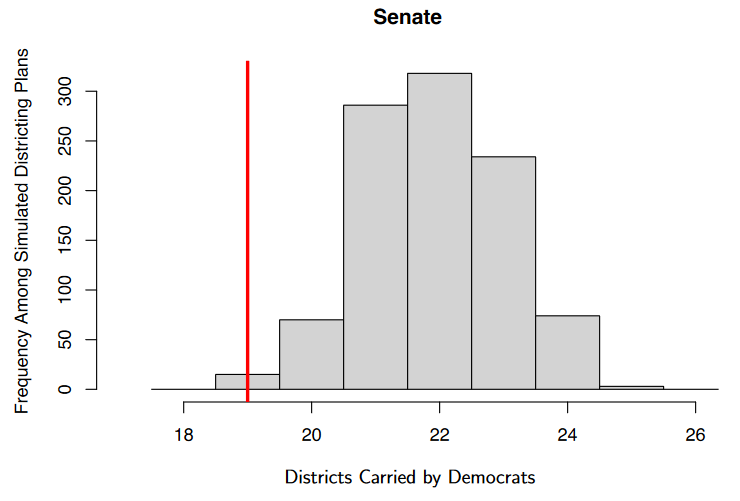
Magleby found that the most likely outcome from drawing North Carolina Senate districts using politically neutral criteria is a 28-22 Republican map (see Figure 2).
Figure 2: Graph from Dr. Daneil Magleby indicating that a 28-22 Republican majority is the most likely outcome of a map drawn using politically neutral criteria. Graphic source: Page 17 of Magleby’s written testimony in North Carolina League of Conservation Voters v. Hall.
Two important caveats: First, Magleby did not include keeping municipalities whole in the list of criteria he used in his ensemble of districts. Second, while he wrote that his senate districts were within the county clusters, he did not confirm that he kept as many counties as possible whole within those clusters (as required by law). Those two factors may have made his maps friendlier to Democrats than they otherwise would have been.