North Carolina has been under a government-mandated shutdown for weeks – a shutdown that the government has justified with data that were riddled with errors and mispredictions. In his research brief this week, JLF’s Dr. Don van der Vaart explains the issues with the data, the lack of government transparency, and what we can determine with the data we do have. Dr. van der Vaart writes:
Since the beginning of the COVID-19 pandemic, a drumbeat of “experts” peddling flawed models predicted a catastrophic death toll. Some of these statistical models even reached a level of notoriety, such as the Imperial College model, before “amateurs” exposed the many defects in what is best described as statistical alchemy. After months of relying on these models to guide policy, New York Governor Andrew Cuomo and others acknowledged that all of the national experts and their projection models were unequivocally wrong.
The Imperial College model is not the only fatally flawed model used to justify stay-at-home orders. Dr. van der Vaart explains:
North Carolina Department of Health and Human Services (DHSS) Secretary Dr. Mandy Cohen jettisoned available models and relied on one developed by a consortium of North Carolina academics and researchers to guide the Cooper administration coronavirus response policy. That model predicted 250,000 more infections by the end of May, even with continued social distancing and stay-at-home restrictions. North Carolina has approximately 24,000 infections confirmed by lab tests now. Recognizing that asymptomatic individuals have not been tested, the model appears to have been unequivocally wrong. Secretary Cohen is no longer relying on that model to inform the reopening policy.
Whatever science and data Gov. Cooper is using now are unclear, as DHHS refuses to share any of this information with the public. DHHS has been so secretive about its data that state and national media outlets had to file a lawsuit to get this information from the Cooper administration. However, the data that we do have about COVID-19 in North Carolina only seem to justify loosening restrictions further. Dr. van der Vaart writes:
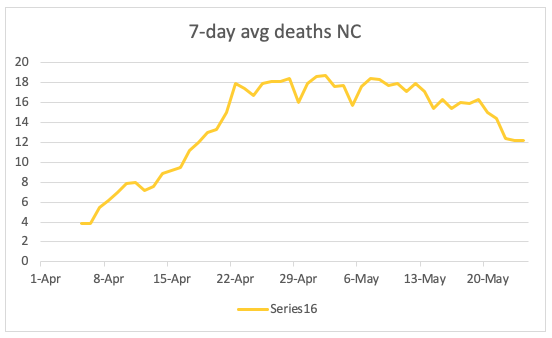
[S]imply looking at a 7-day rolling average (to smooth out reporting inconsistencies) of daily reported deaths is revealing.
The data appear to show a rapid rise, a leveling, and then a decline in the deaths from COVID-19 in North Carolina. In fact, the state appears to have turned the corner somewhere around May 6. Again, this is a lagging indicator…
[T[he number of tests performed in North Carolina has risen dramatically. The more people that are tested, the more positives will be found, even if the percentage does not change. To correct for this, the same 14-day calculation was made, but this time dividing by the total tests reported for each day. This serves to correct for days when a lot of tests were taken. In addition, a 7-day rolling average was used to smooth out reporting irregularities.
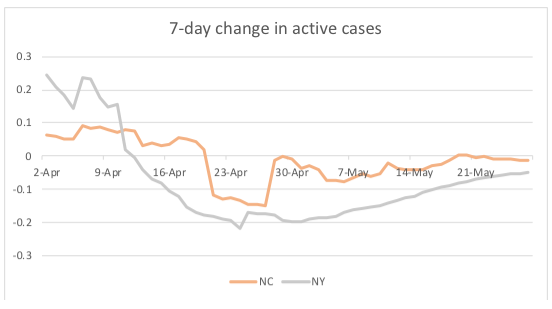
Both of these indicators show a slowing of the virus. Dr. van der Vaart writes:
Both of these metrics indicate that North Carolina surpassed the threat of increased infections roughly between the last week in April and the first week in May. Hence, the threat of overwhelming our health care system passed many weeks ago. The threat of economic hardship, however, is still ahead of us.
Read the full brief here. Read Dr. van der Vaart’s breakdown of more COVID-19 data from last week here.